Udemy Results Presentation Deck
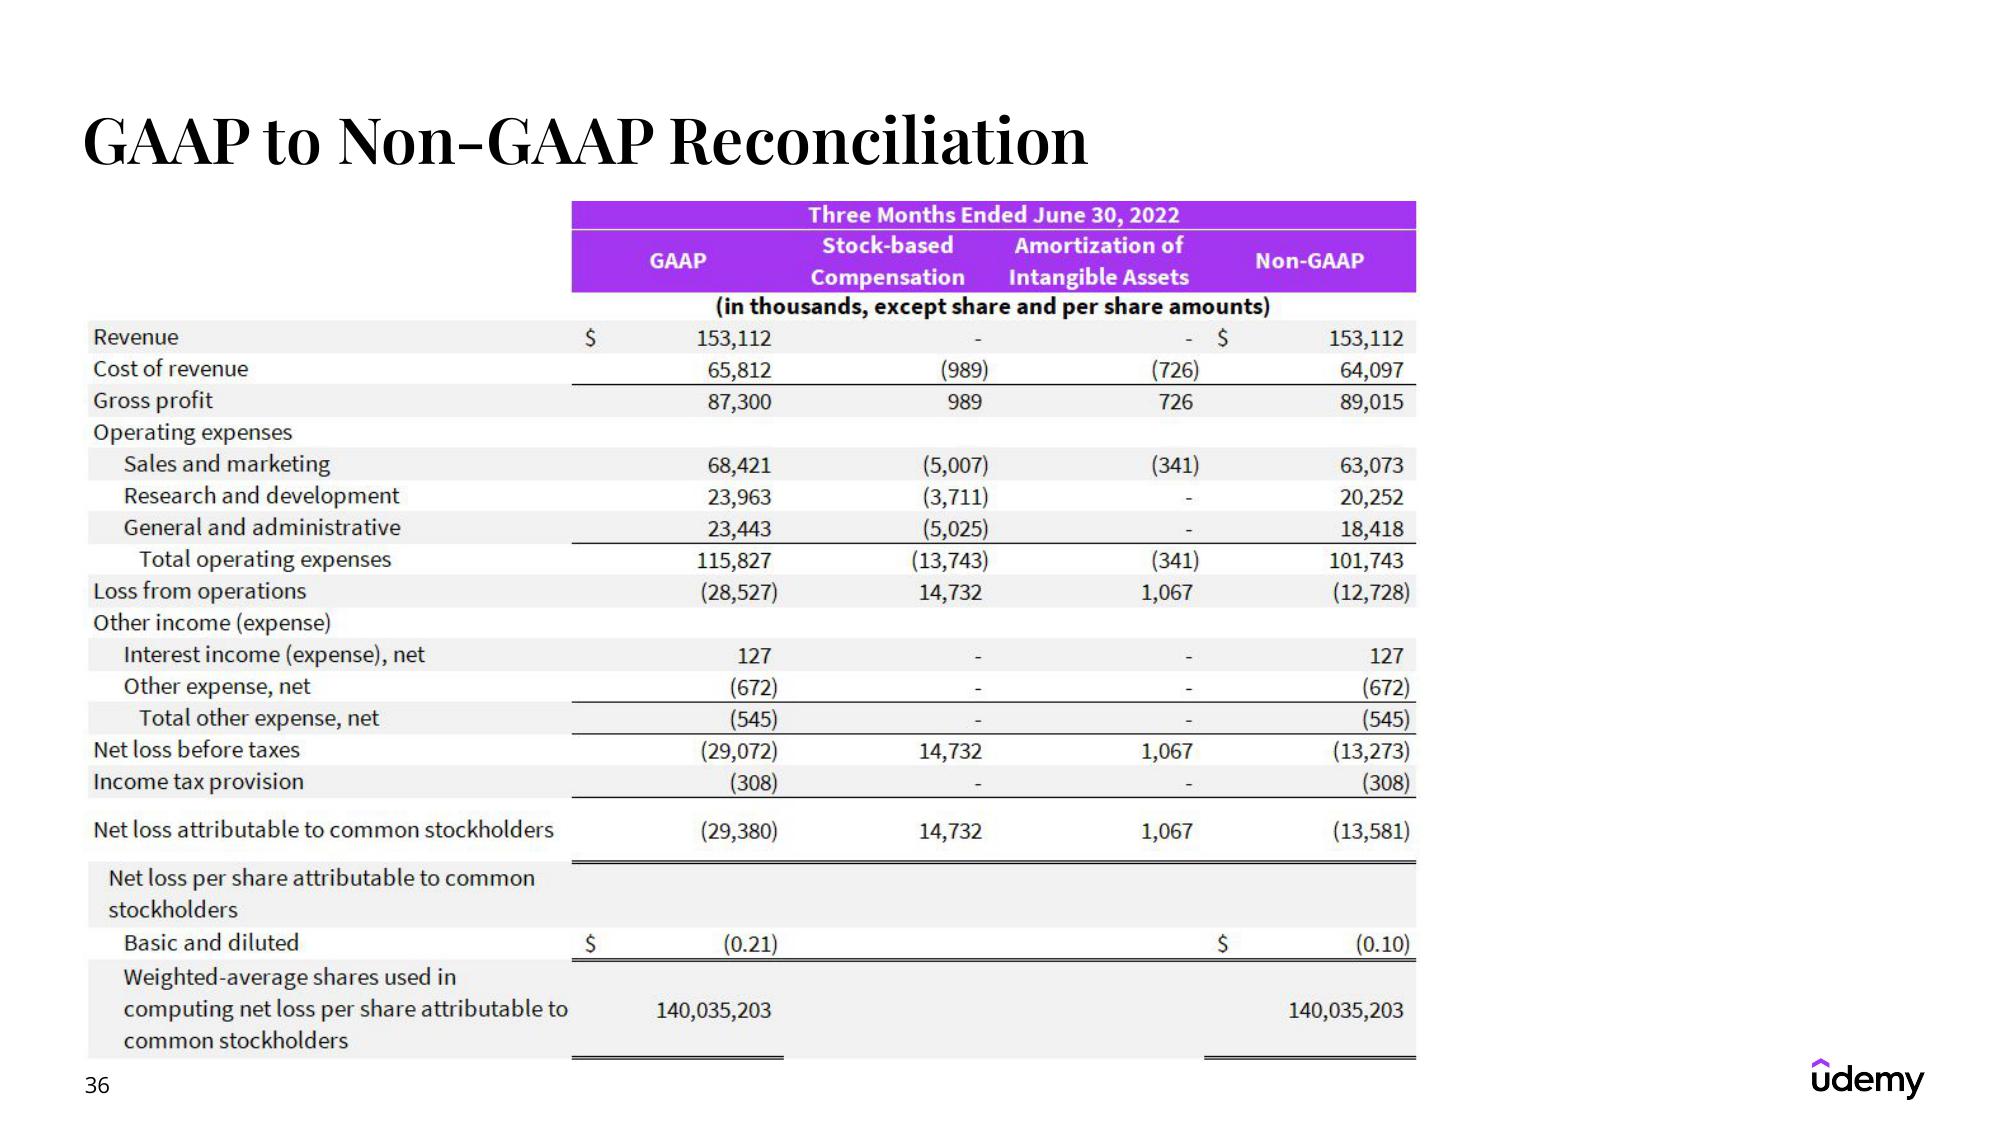
GAAP to Non-GAAP Reconciliation
Revenue
Cost of revenue
Gross profit
Operating expenses
Sales and marketing
Research and development
General and administrative
Total operating expenses
Loss from operations
Other income (expense)
36
Interest income (expense), net
Other expense, net
Total other expense, net
Net loss before taxes
Income tax provision
Net loss attributable to common stockholders
Net loss per share attributable to common
stockholders
Basic and diluted
Weighted-average shares used in
computing net loss per share attributable to
common stockholders
$
$
Three Months Ended June 30, 2022
Stock-based Amortization of
Compensation Intangible Assets
(in thousands, except share and per share amounts)
153,112
$
65,812
87,300
GAAP
68,421
23,963
23,443
115,827
(28,527)
127
(672)
(545)
(29,072)
(308)
(29,380)
(0.21)
140,035,203
(989)
989
(5,007)
(3,711)
(5,025)
(13,743)
14,732
14,732
14,732
-
(726)
726
(341)
(341)
1,067
1,067
1,067
$
Non-GAAP
153,112
64,097
89,015
63,073
20,252
18,418
101,743
(12,728)
127
(672)
(545)
(13,273)
(308)
(13,581)
(0.10)
140,035,203
ûdemyView entire presentation