Satellogic SPAC
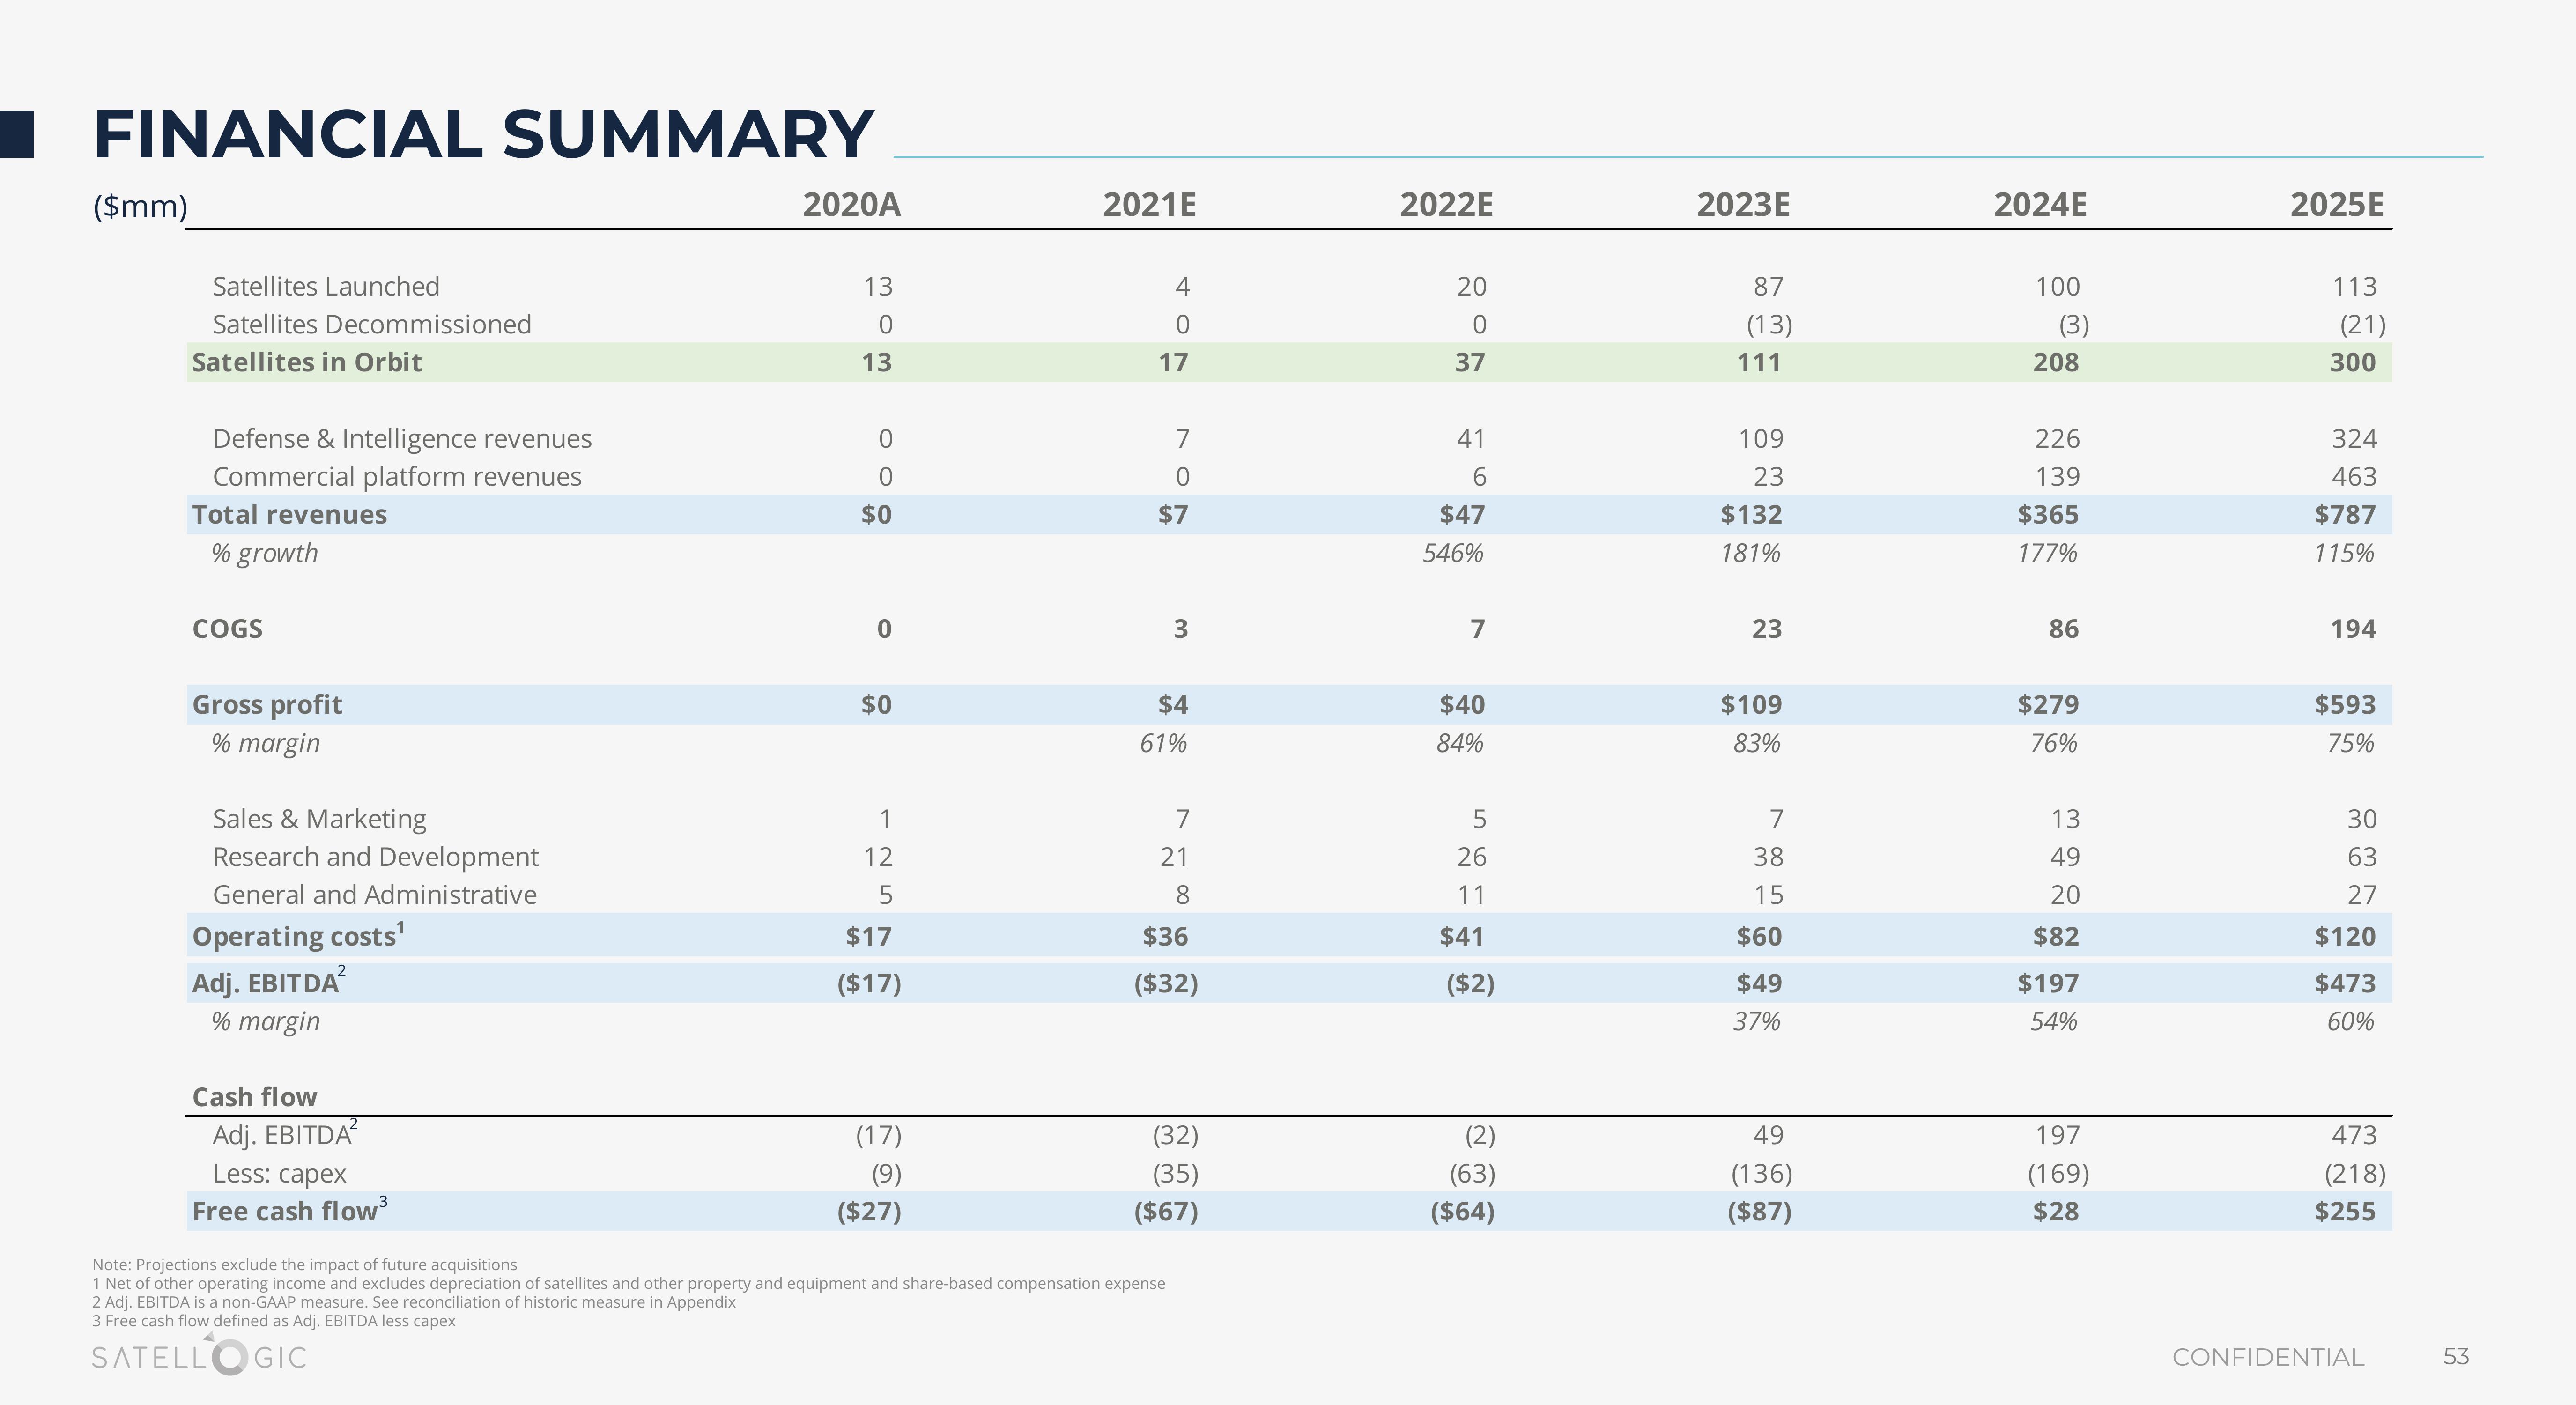
FINANCIAL SUMMARY
($mm)
Satellites Launched
Satellites Decommissioned
Satellites in Orbit
Defense & Intelligence revenues
Commercial platform revenues
Total revenues
% growth
COGS
Gross profit
% margin
Sales & Marketing
Research and Development
General and Administrative
Operating costs¹
Adj. EBITDA²
% margin
Cash flow
Adj. EBITDA²
Less: capex
Free cash flow³
2020A
13
0
13
0
0
$0
0
$0
1
12
5
$17
($17)
(17)
(9)
($27)
2021E
407
17
7
0
$7
3
$4
61%
7
21
Note: Projections exclude the impact of future acquisitions
1 Net of other operating income and excludes depreciation of satellites and other property and equipment and share-based compensation expense
2 Adj. EBITDA is a non-GAAP measure. See reconciliation of historic measure in Appendix
3 Free cash flow defined as Adj. EBITDA less capex
SATELL
GIC
8
$36
($32)
(32)
(35)
($67)
2022E
20
0
37
41
6
$47
546%
7
$40
84%
5
26
11
$41
($2)
(2)
(63)
($64)
2023E
87
(13)
111
109
23
$132
181%
23
$109
83%
7
38
15
$60
$49
37%
49
(136)
($87)
2024E
100
(3)
208
226
139
$365
177%
86
$279
76%
13
49
20
$82
$197
54%
197
(169)
$28
2025E
113
(21)
300
324
463
$787
115%
194
$593
75%
30
63
27
$120
$473
60%
473
(218)
$255
CONFIDENTIAL
53View entire presentation