Commercial Metals Company Results Presentation Deck
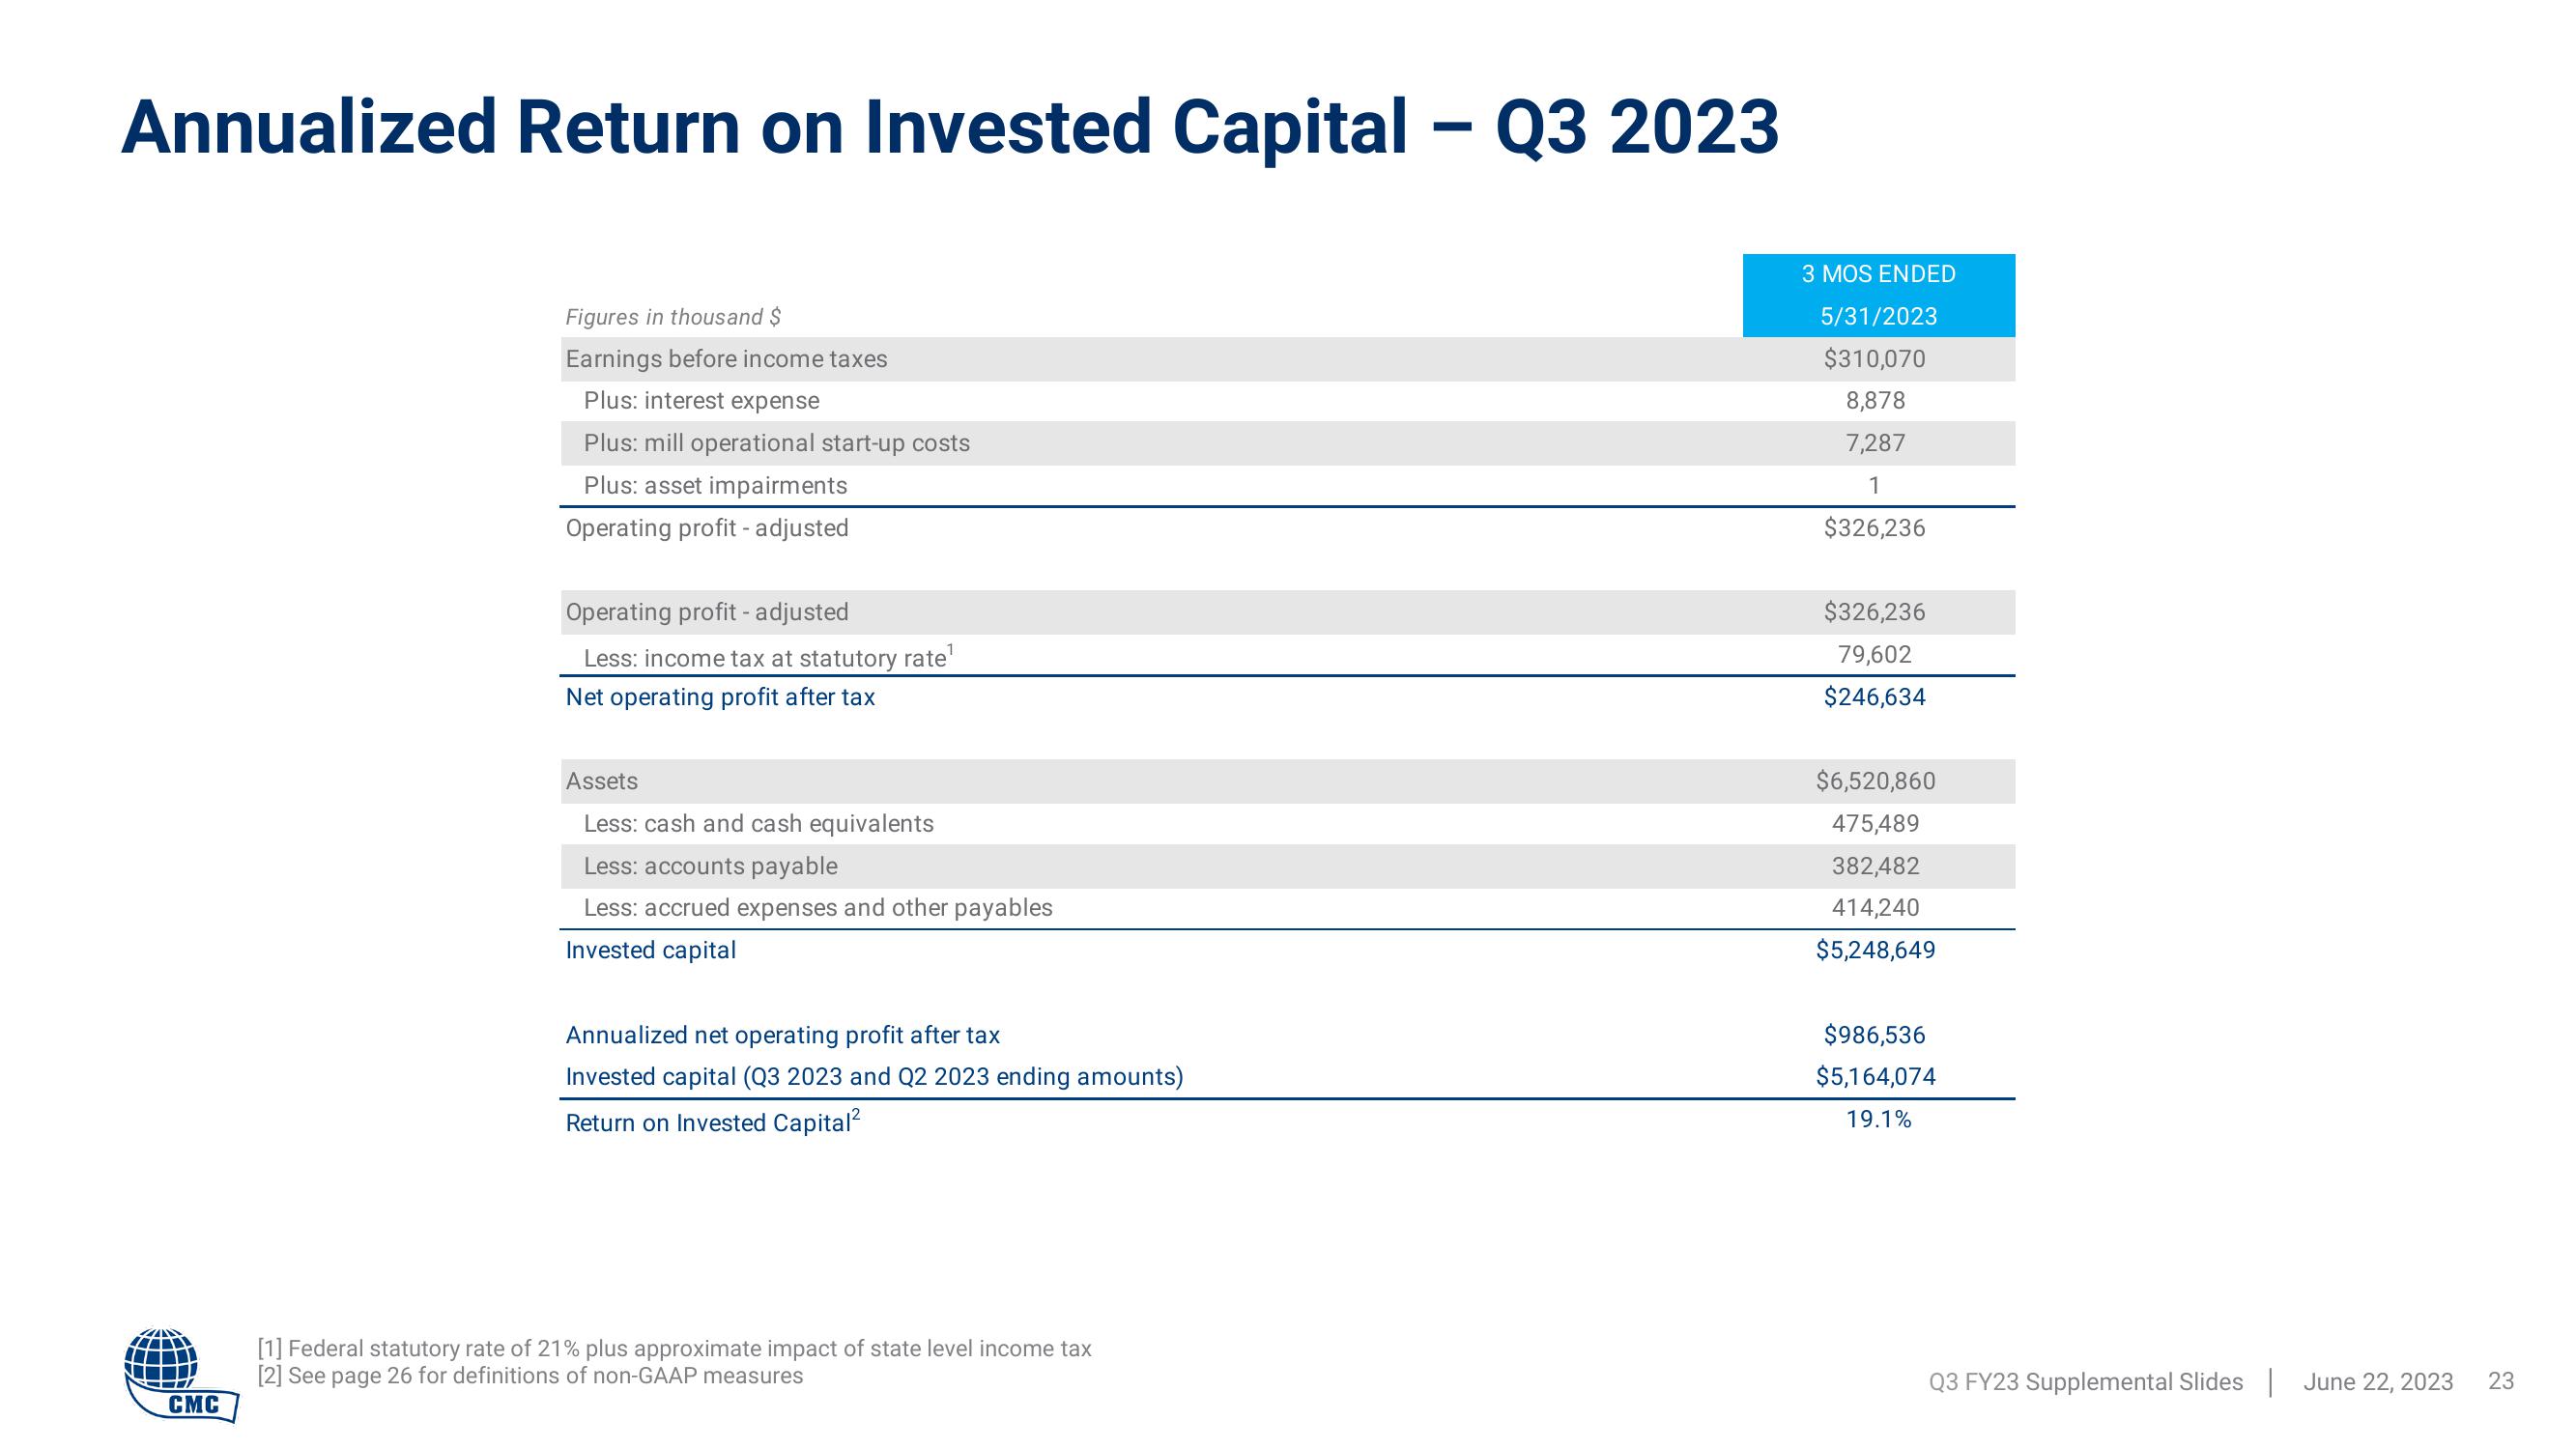
Annualized Return on Invested Capital - Q3 2023
CMC
Figures in thousand $
Earnings before income taxes
Plus: interest expense
Plus: mill operational start-up costs
Plus: asset impairments
Operating profit - adjusted
Operating profit - adjusted
Less: income tax at statutory rate¹
Net operating profit after tax
Assets
Less: cash and cash equivalents
Less: accounts payable
Less: accrued expenses and other payables
Invested capital
Annualized net operating profit after tax
Invested capital (Q3 2023 and Q2 2023 ending amounts)
Return on Invested Capital²
[1] Federal statutory rate of 21% plus approximate impact of state level income tax
[2] See page 26 for definitions of non-GAAP measures
3 MOS ENDED
5/31/2023
$310,070
8,878
7,287
1
$326,236
$326,236
79,602
$246,634
$6,520,860
475,489
382,482
414,240
$5,248,649
$986,536
$5,164,074
19.1%
Q3 FY23 Supplemental Slides June 22, 2023
23View entire presentation