Dutch Bros Results Presentation Deck
QUARTERLY FINANCIALS
1
2
3
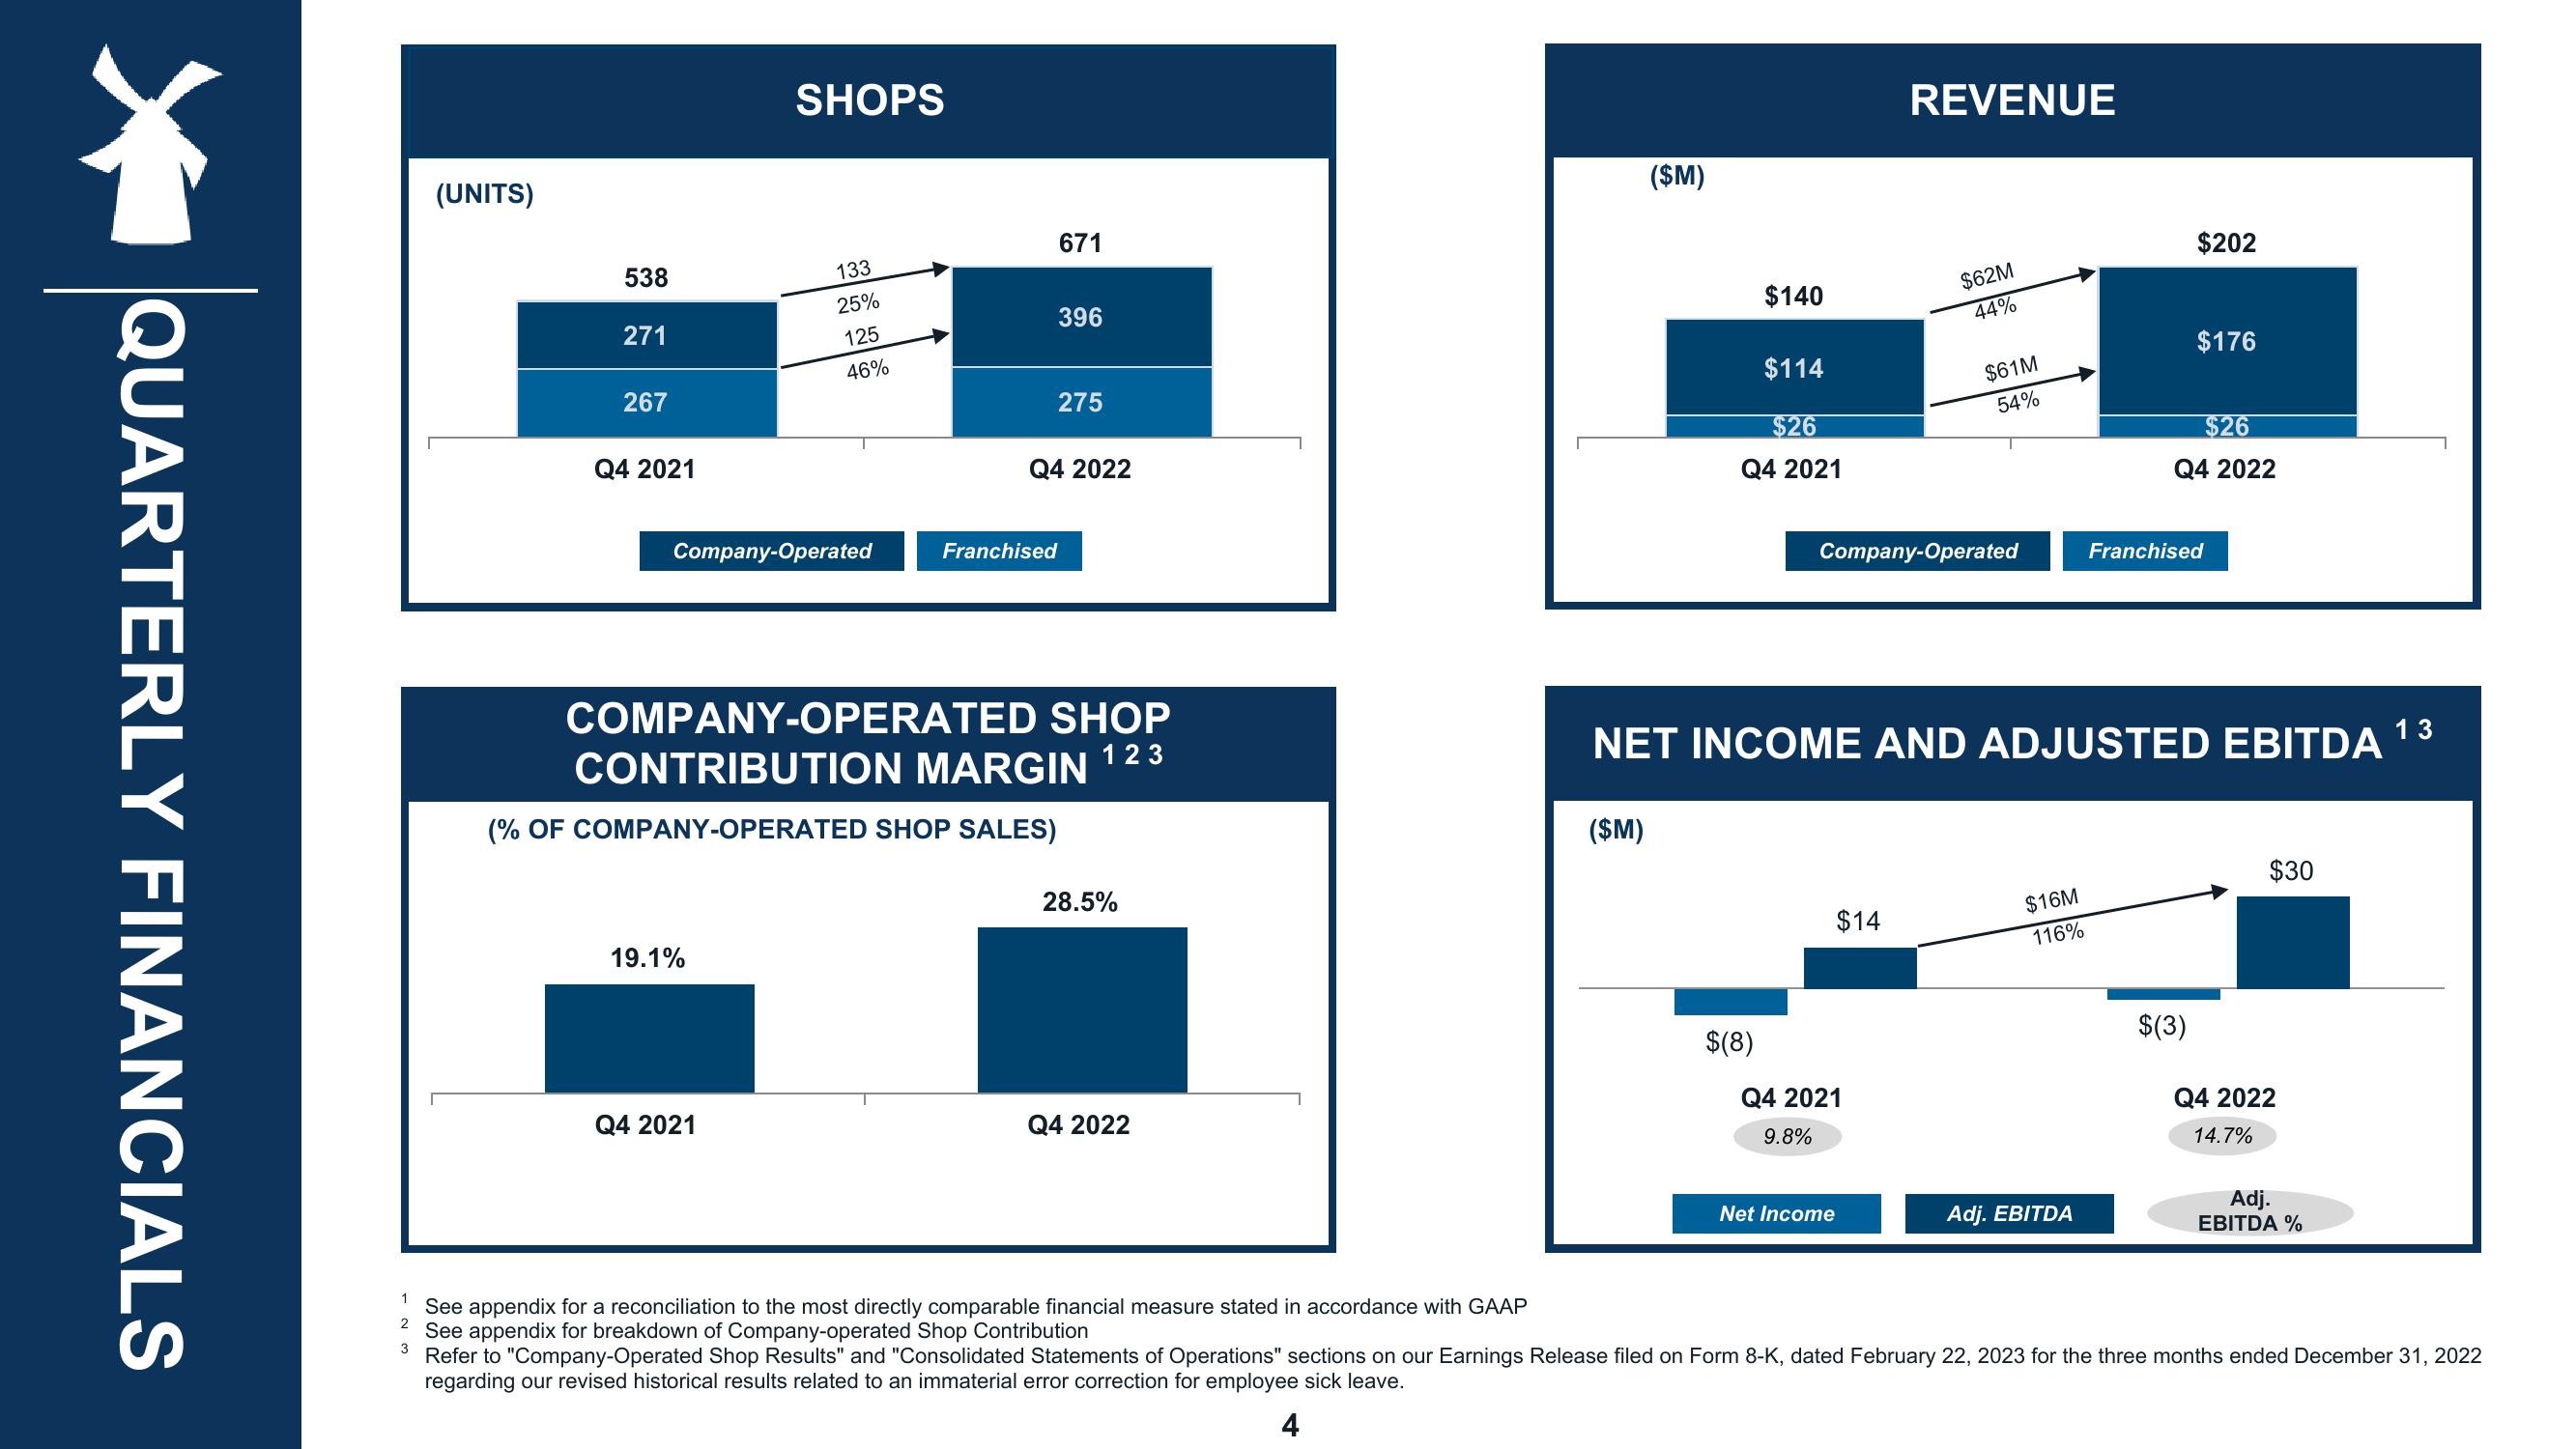
(UNITS)
538
271
267
Q4 2021
SHOPS
Company-Operated
133
25%
125
46%
19.1%
Q4 2021
Franchised
(% OF COMPANY-OPERATED SHOP SALES)
671
396
Q4 2022
COMPANY-OPERATED SHOP
CONTRIBUTION MARGIN 123
275
28.5%
Q4 2022
($M)
($M)
$140
$114
$26
Q4 2021
$(8)
REVENUE
Company-Operated
$14
Q4 2021
9.8%
Net Income
$62M
44%
$61M
54%
NET INCOME AND ADJUSTED EBITDA
$16M
116%
Adj. EBITDA
$202
$176
$26
Q4 2022
Franchised
$(3)
$30
Q4 2022
14.7%
Adj.
EBITDA %
13
See appendix for a reconciliation to the most directly comparable financial measure stated in accordance with GAAP
See appendix for breakdown of Company-operated Shop Contribution
Refer to "Company-Operated Shop Results" and "Consolidated Statements of Operations" sections on our Earnings Release filed on Form 8-K, dated February 22, 2023 for the three months ended December 31, 2022
regarding our revised historical results related to an immaterial error correction for employee sick leave.
4View entire presentation