Ciena Corporation Earnings Presentation
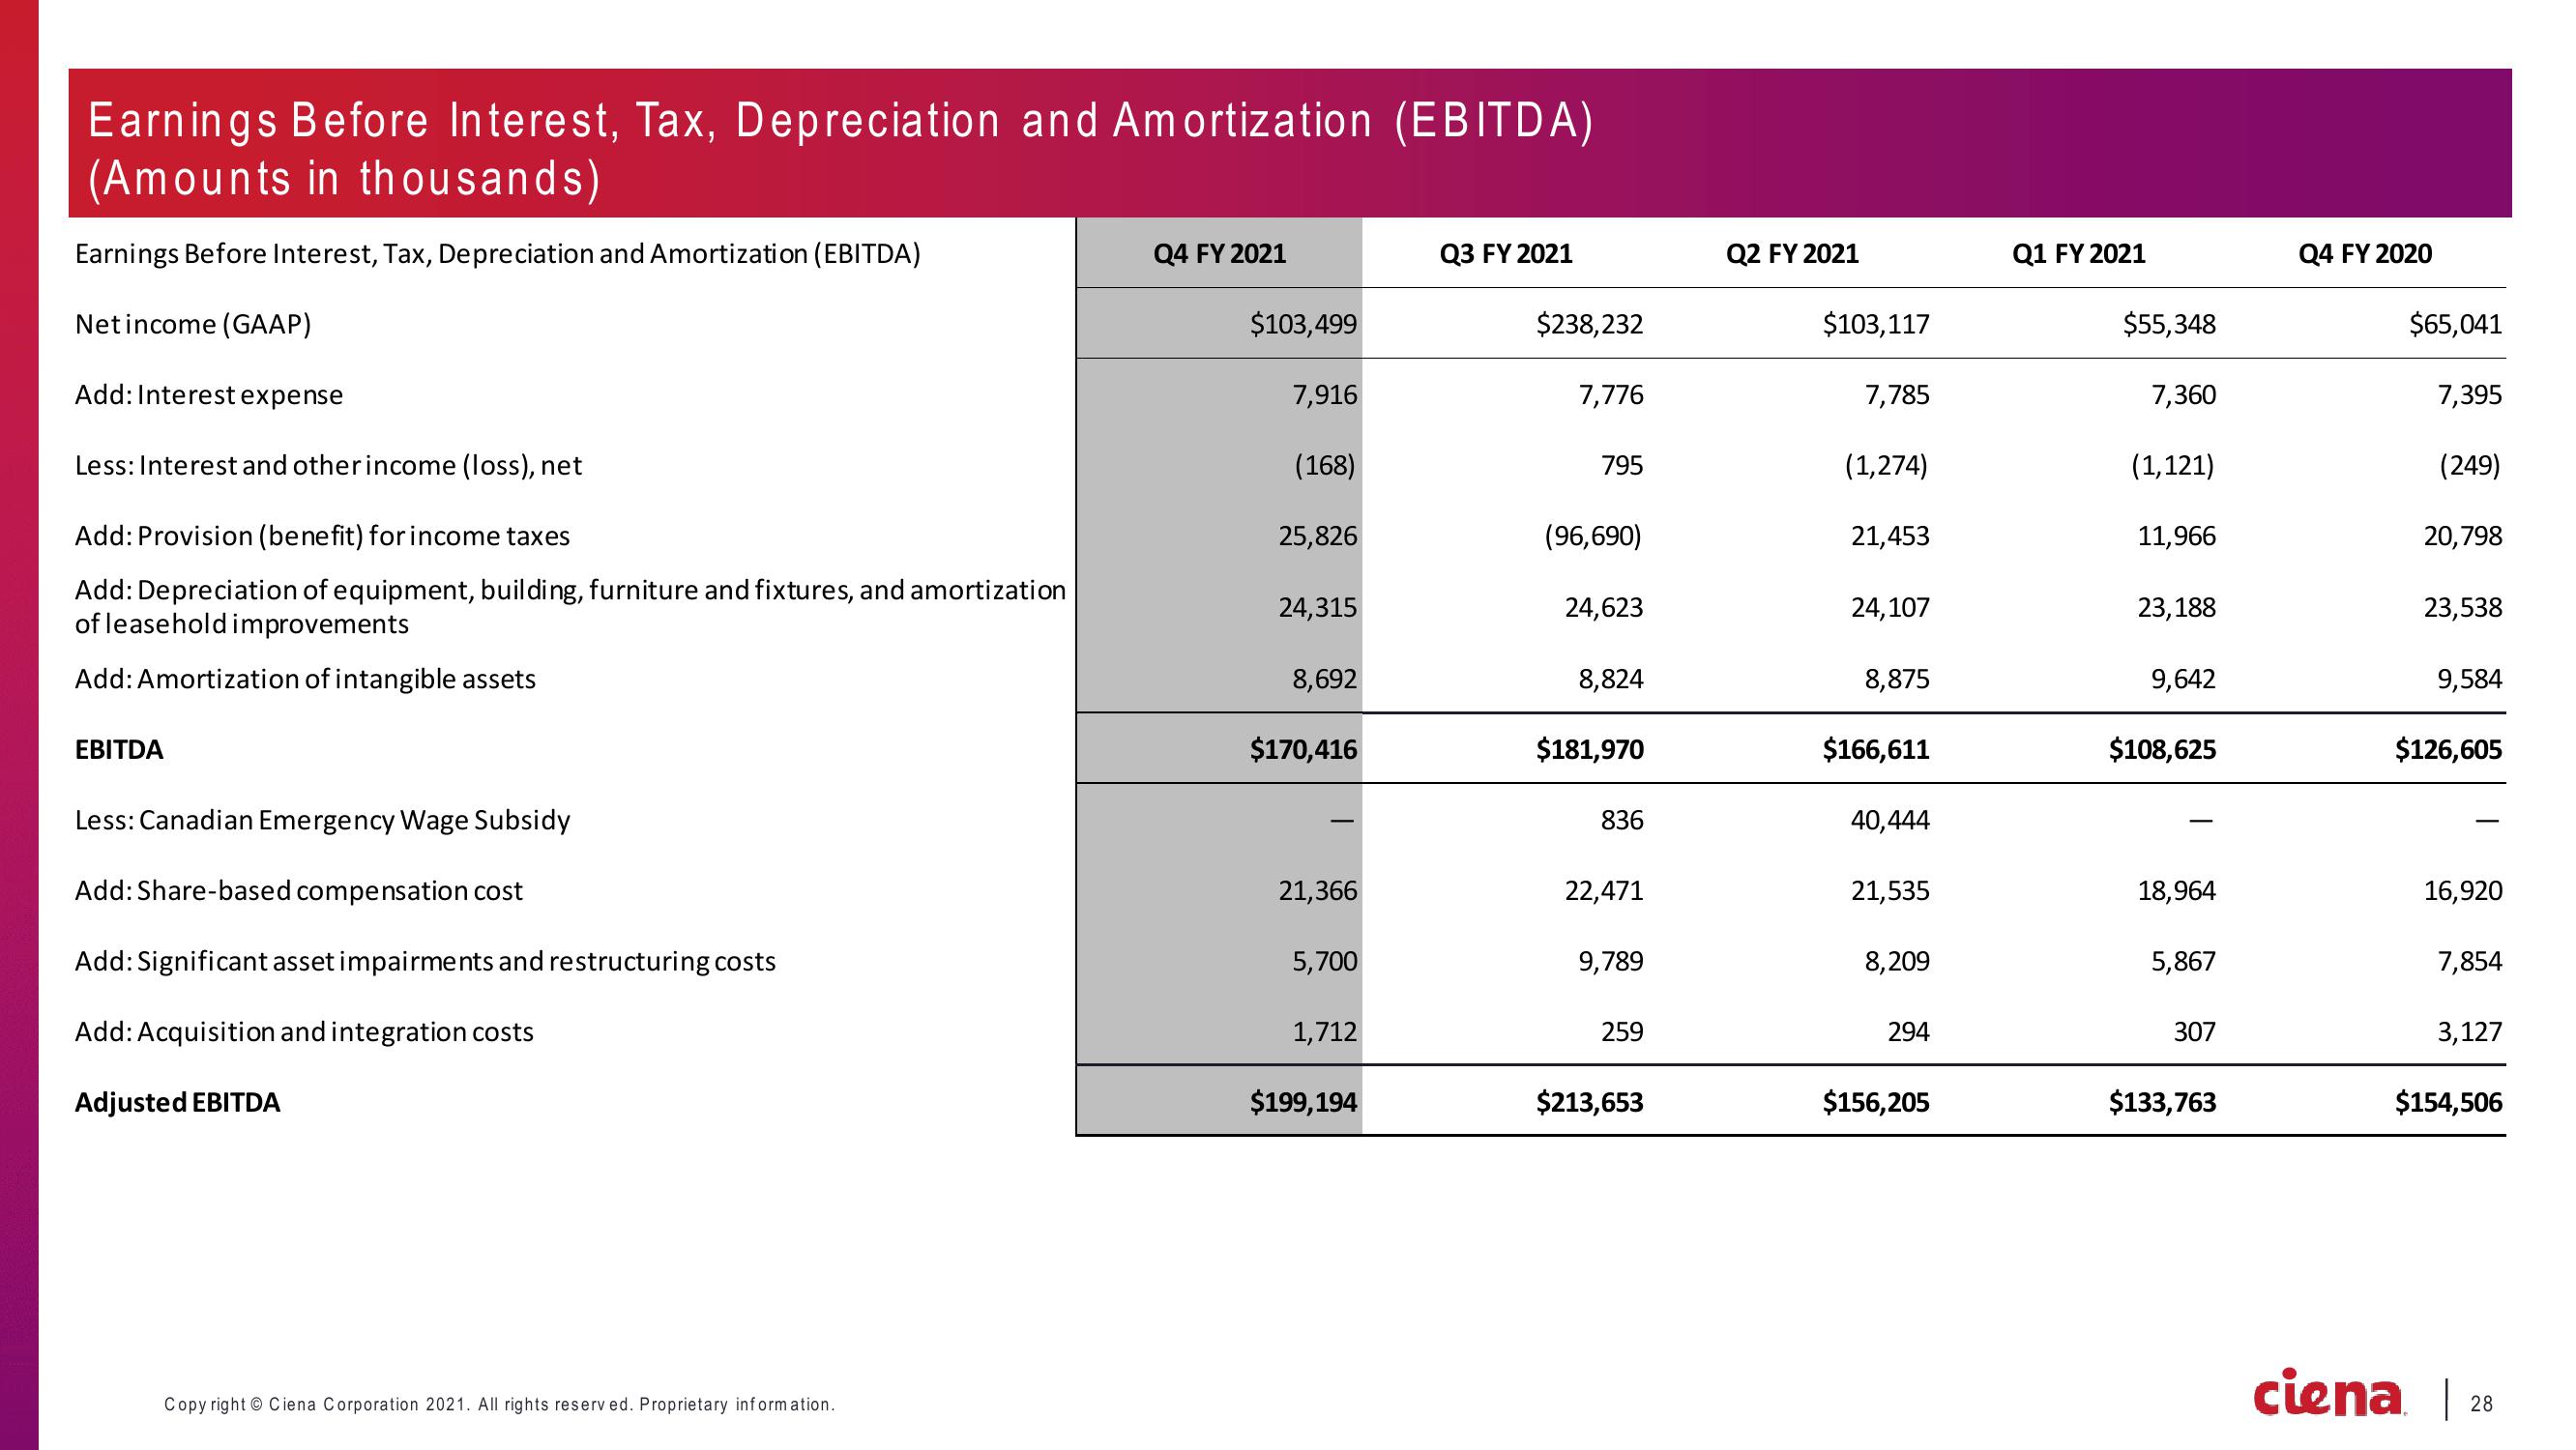
Earnings Before Interest, Tax, Depreciation and Amortization (EBITDA)
(Amounts in thousands)
Earnings Before Interest, Tax, Depreciation and Amortization (EBITDA)
Net income (GAAP)
Add: Interest expense
Less: Interest and other income (loss), net
Add: Provision (benefit) for income taxes
Add: Depreciation of equipment, building, furniture and fixtures, and amortization
of leasehold improvements
Add: Amortization of intangible assets
EBITDA
Less: Canadian Emergency Wage Subsidy
Add: Share-based compensation cost
Add: Significant asset impairments and restructuring costs
Add: Acquisition and integration costs
Adjusted EBITDA
Copyright © Ciena Corporation 2021. All rights reserved. Proprietary information.
Q4 FY 2021
$103,499
7,916
(168)
25,826
24,315
8,692
$170,416
21,366
5,700
1,712
$199,194
Q3 FY 2021
$238,232
7,776
795
(96,690)
24,623
8,824
$181,970
836
22,471
9,789
259
$213,653
Q2 FY 2021
$103,117
7,785
(1,274)
21,453
24,107
8,875
$166,611
40,444
21,535
8,209
294
$156,205
Q1 FY 2021
$55,348
7,360
(1,121)
11,966
23,188
9,642
$108,625
18,964
5,867
307
$133,763
Q4 FY 2020
$65,041
7,395
(249)
20,798
23,538
9,584
$126,605
16,920
7,854
3,127
$154,506
ciena 28View entire presentation