BenevolentAI Investor Presentation Deck
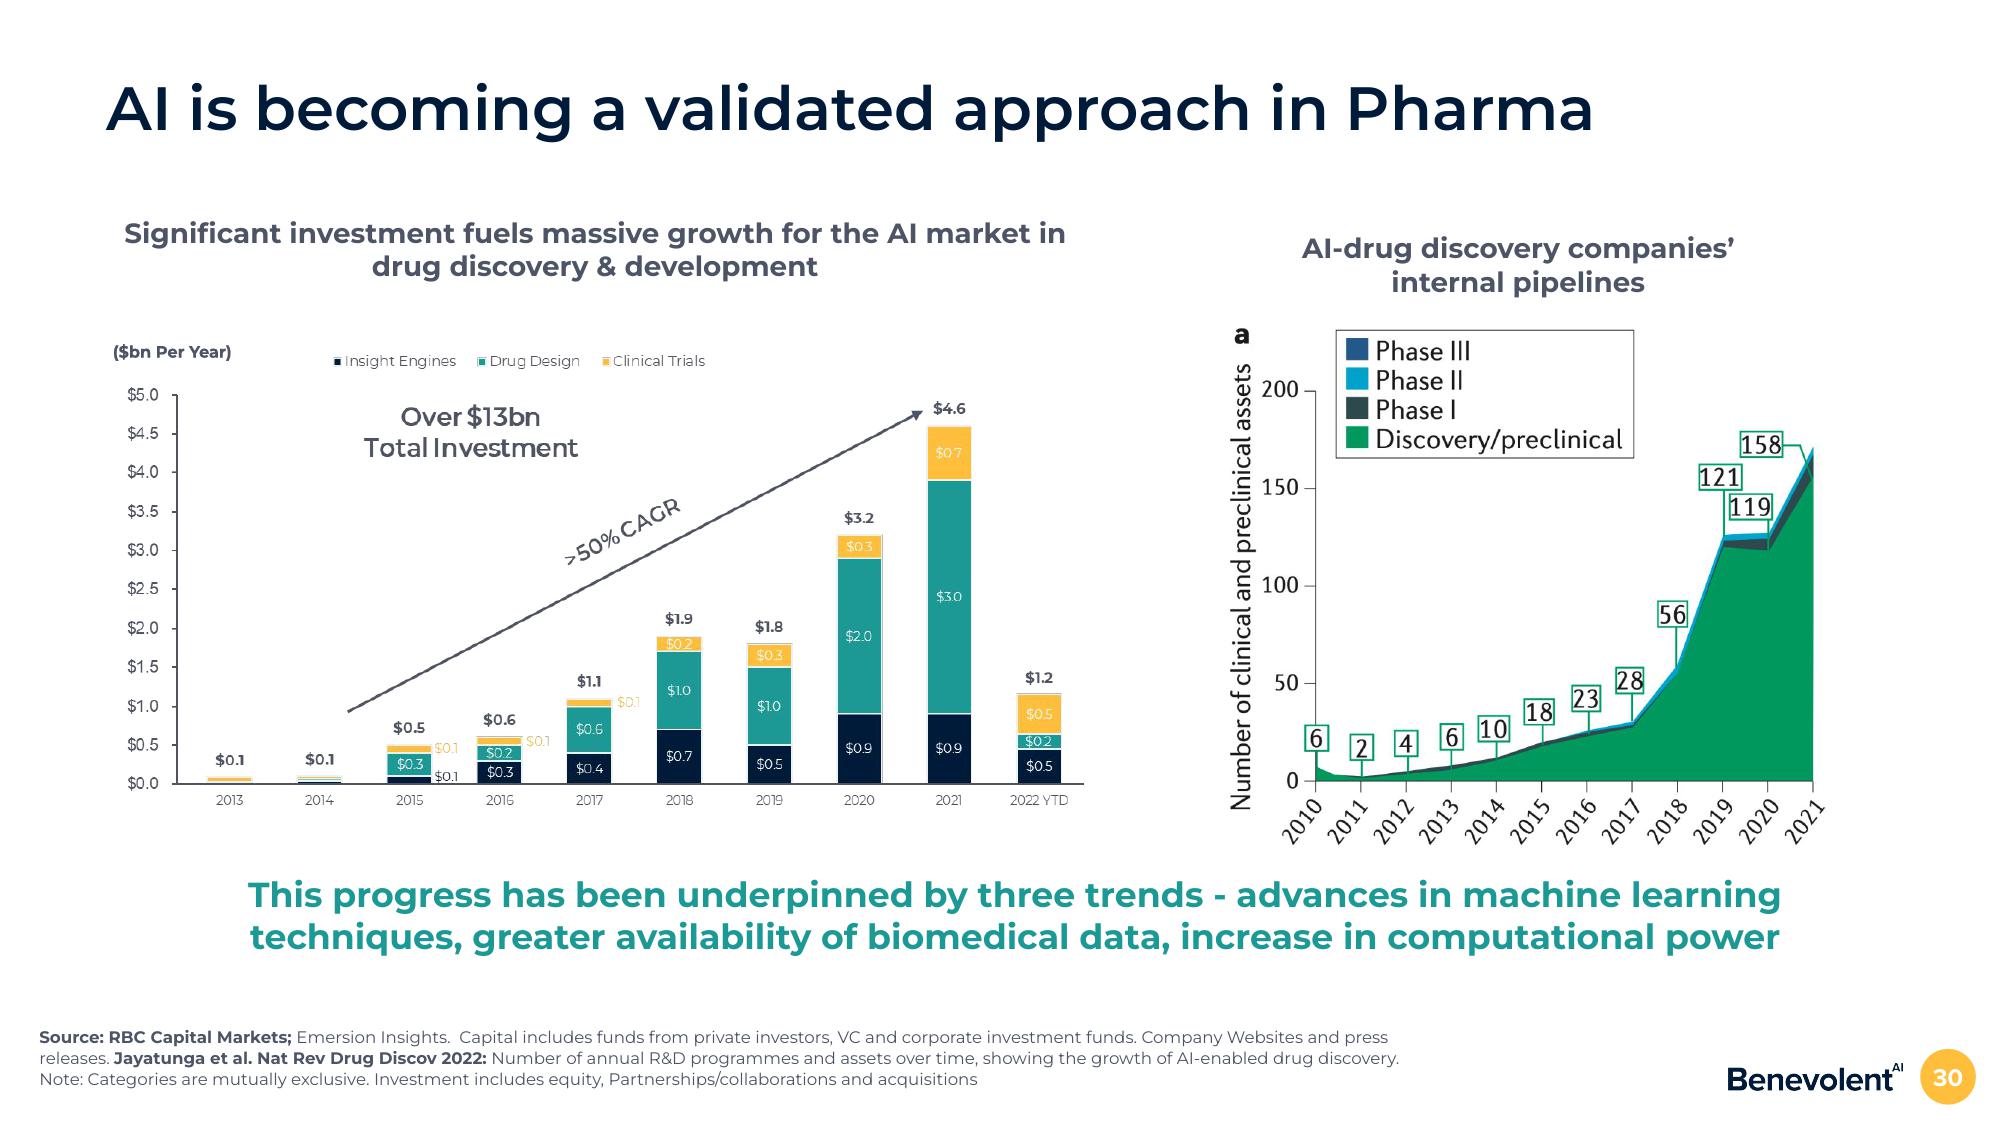
Al is becoming a validated approach in Pharma
Significant investment fuels massive growth for the Al market in
drug discovery & development
($bn Per Year)
$5.0
$4.5
$4.0
$3.5
$3.0
$2.5
$2.0
$1.5
$1.0
$0.5
$0.0
$0.1
2013
$0.1
2014
Insight Engines Drug Design Clinical Trials
Over $13bn
Total Investment
$0.5
$0.3
2015
$0.1
$0.1
$0.6
$0.2
$0.3
2016
$0.1
>50% CAGR
$1.1
$0.6
$0.4
2017
$0.1
$1.9
50.2
$1.0
$0.7
2018
$1.8
$0.3
$1.0
$0.5
2019
$3.2
$03
$2.0
$0.9
2020
$4.6
$0.7
$3.0
$0.9
2021
$1.2
$0.5
$02
$0.5
2022 YTD
Number of clinical and preclinical assets
200-
150
100
50
Al-drug discovery companies'
internal pipelines
0
2010
Phase III
Phase II
Phase I
| Discovery/preclinical
2011
2012
Source: RBC Capital Markets; Emersion Insights. Capital includes funds from private investors, VC and corporate investment funds. Company Websites and press
releases. Jayatunga et al. Nat Rev Drug Discov 2022: Number of annual R&D programmes and assets over time, showing the growth of Al-enabled drug discovery.
Note: Categories are mutually exclusive. Investment includes equity, Partnerships/collaborations and acquisitions
2013
2014
2015
2016
28
2017
56
2018
121
158
119
2019
2020
This progress has been underpinned by three trends - advances in machine learning
techniques, greater availability of biomedical data, increase in computational power
2021
Benevolent 30View entire presentation