Tesla Results Presentation Deck
28
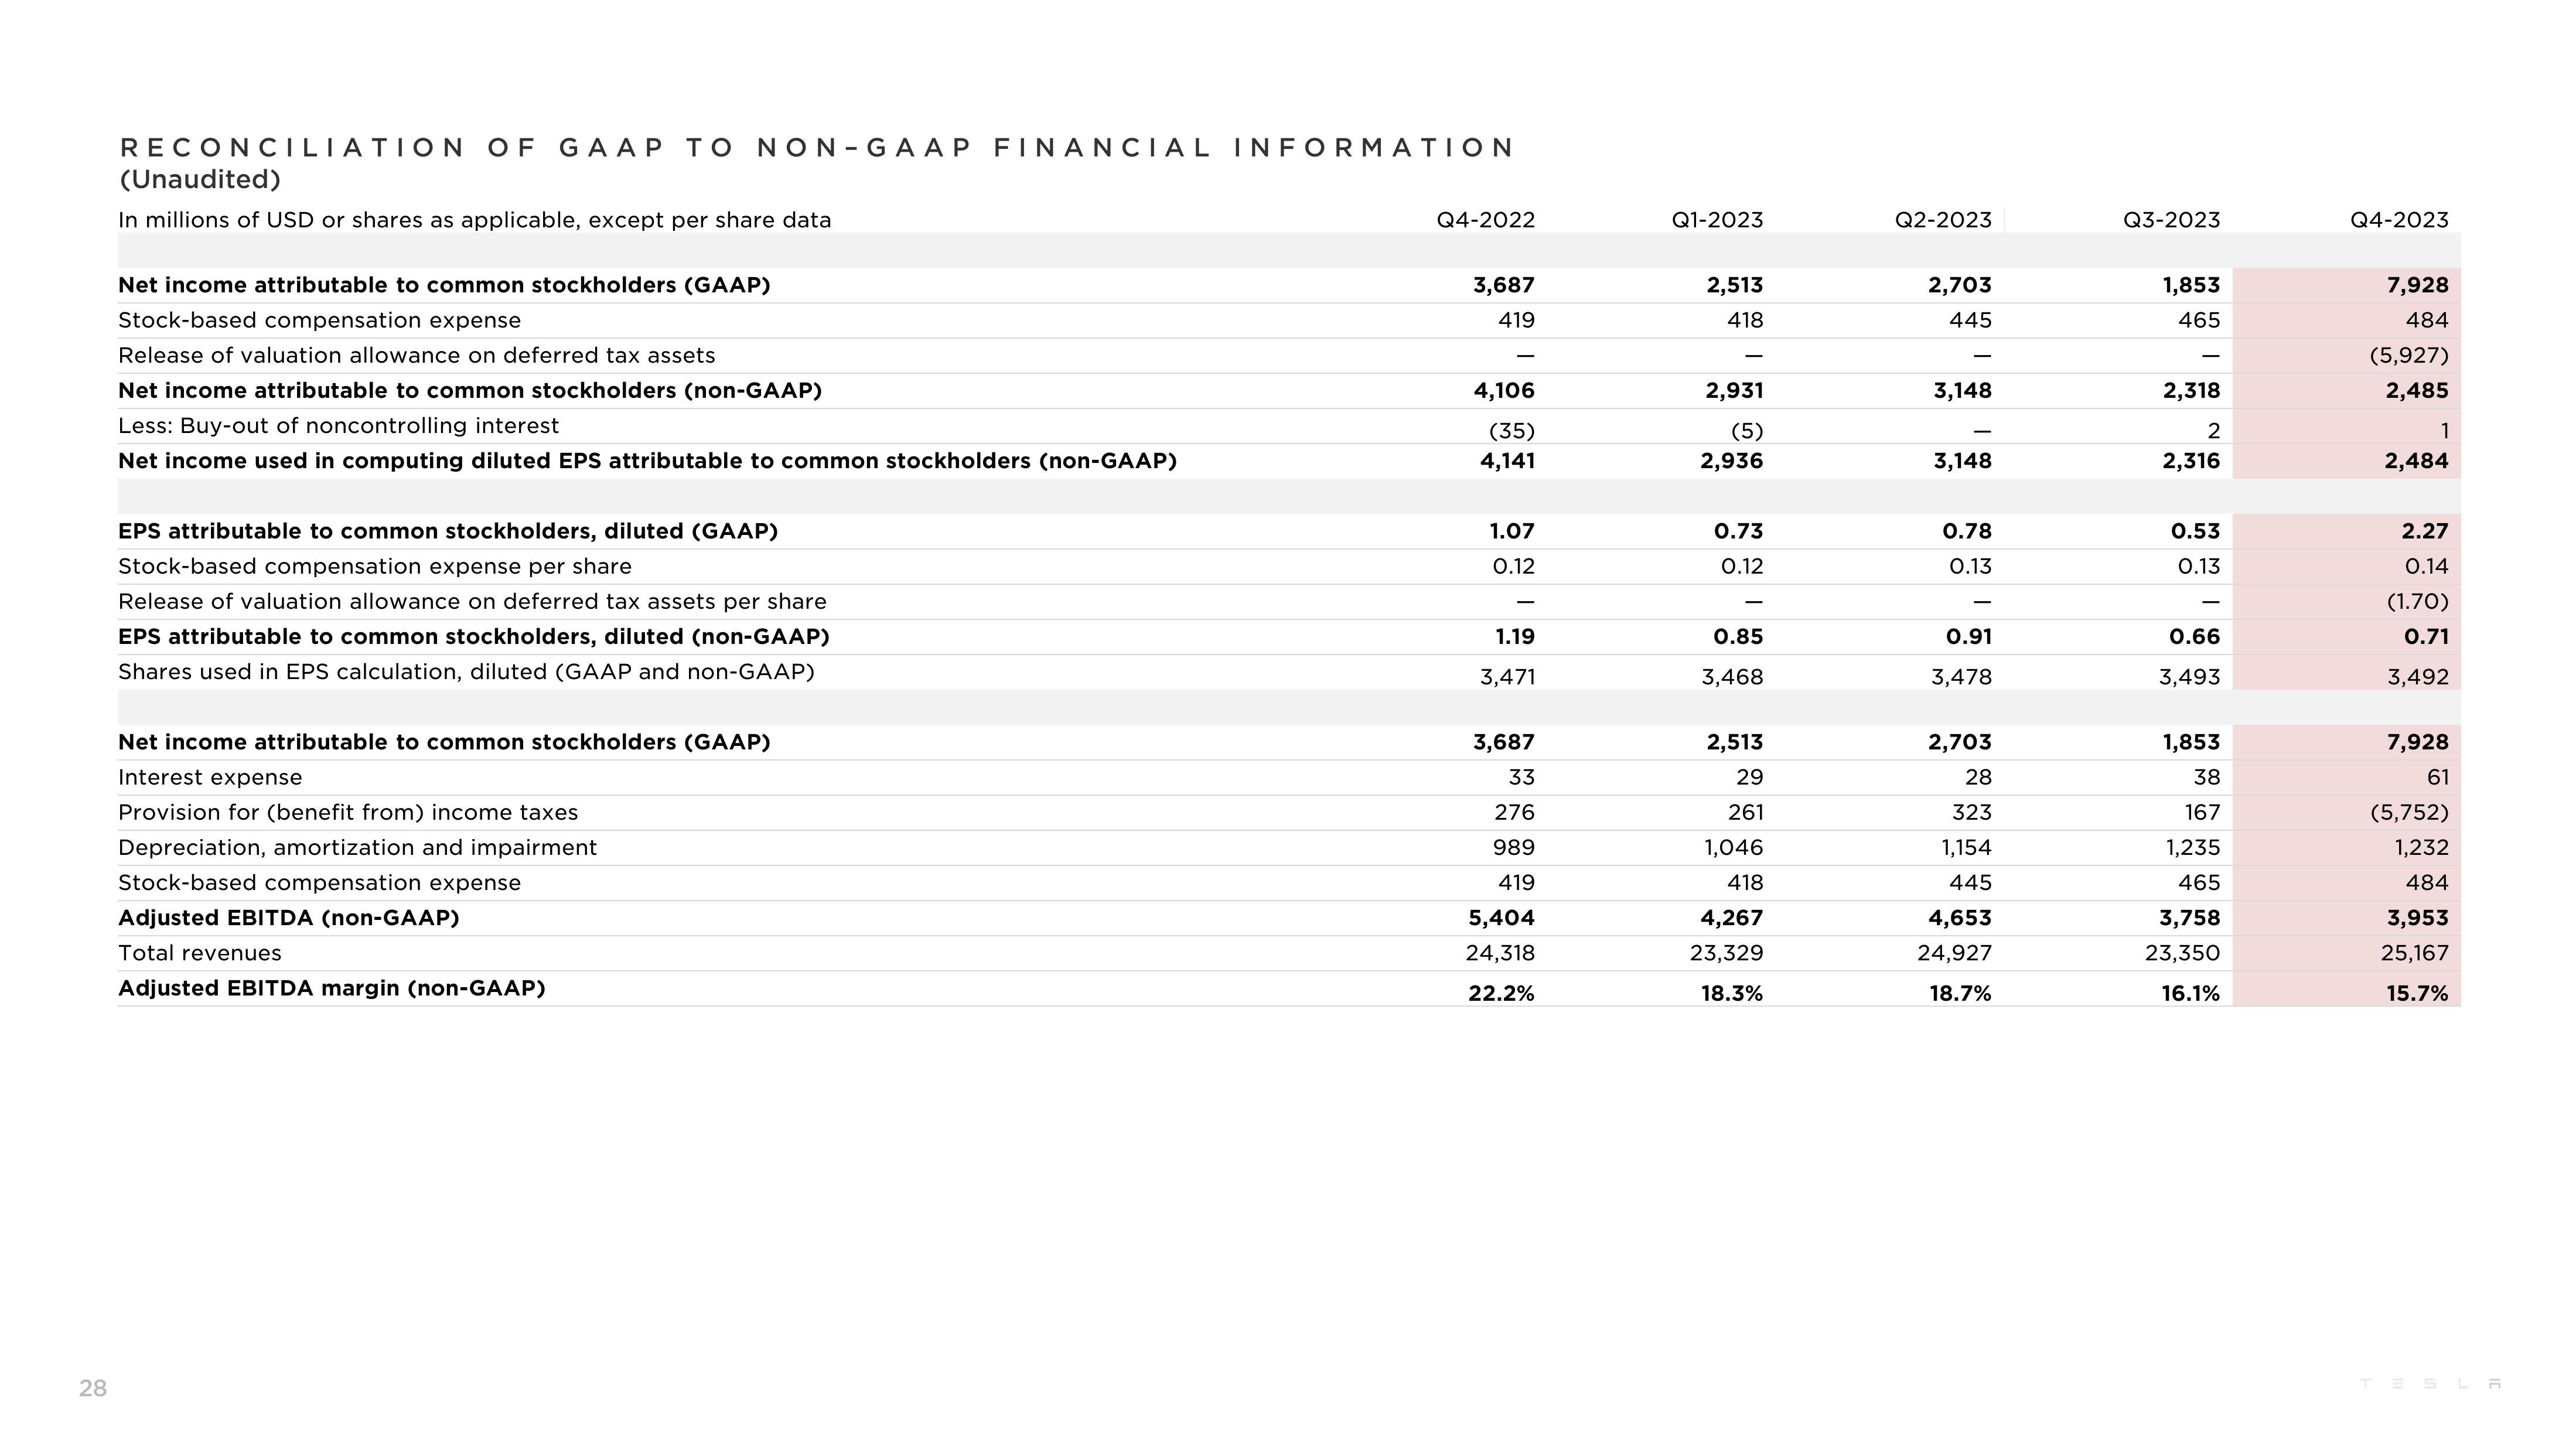
RECONCILIATION OF GAAP TO NON-GAAP FINANCIAL INFORMATION
(Unaudited)
In millions of USD or shares as applicable, except per share data
Net income attributable to common stockholders (GAAP)
Stock-based compensation expense
Release of valuation allowance on deferred tax assets
Net income attributable to common stockholders (non-GAAP)
Less: Buy-out of noncontrolling interest
Net income used in computing diluted EPS attributable to common stockholders (non-GAAP)
EPS attributable to common stockholders, diluted (GAAP)
Stock-based compensation expense per share
Release of valuation allowance on deferred tax assets per share
EPS attributable to common stockholders, diluted (non-GAAP)
Shares used in EPS calculation, diluted (GAAP and non-GAAP)
Net income attributable to common stockholders (GAAP)
Interest expense
Provision for (benefit from) income taxes
Depreciation, amortization and impairment
Stock-based compensation expense
Adjusted EBITDA (non-GAAP)
Total revenues
Adjusted EBITDA margin (non-GAAP)
Q4-2022
3,687
419
4,106
(35)
4,141
1.07
0.12
1.19
3,471
3,687
33
276
989
419
5,404
24,318
22.2%
Q1-2023
2,513
418
2,931
(5)
2,936
0.73
0.12
0.85
3,468
2,513
29
261
1,046
418
4,267
23,329
18.3%
Q2-2023
2,703
445
3,148
3,148
0.78
0.13
0.91
3,478
2,703
28
323
1,154
445
4,653
24,927
18.7%
Q3-2023
1,853
465
2,318
2
2,316
0.53
0.13
0.66
3,493
1,853
38
167
1,235
465
3,758
23,350
16.1%
Q4-2023
7,928
484
(5,927)
2,485
1
2,484
2.27
0.14
(1.70)
0.71
3,492
7,928
61
(5,752)
1,232
484
3,953
25,167
15.7%
TESLAView entire presentation