P3 Health Partners SPAC Presentation Deck
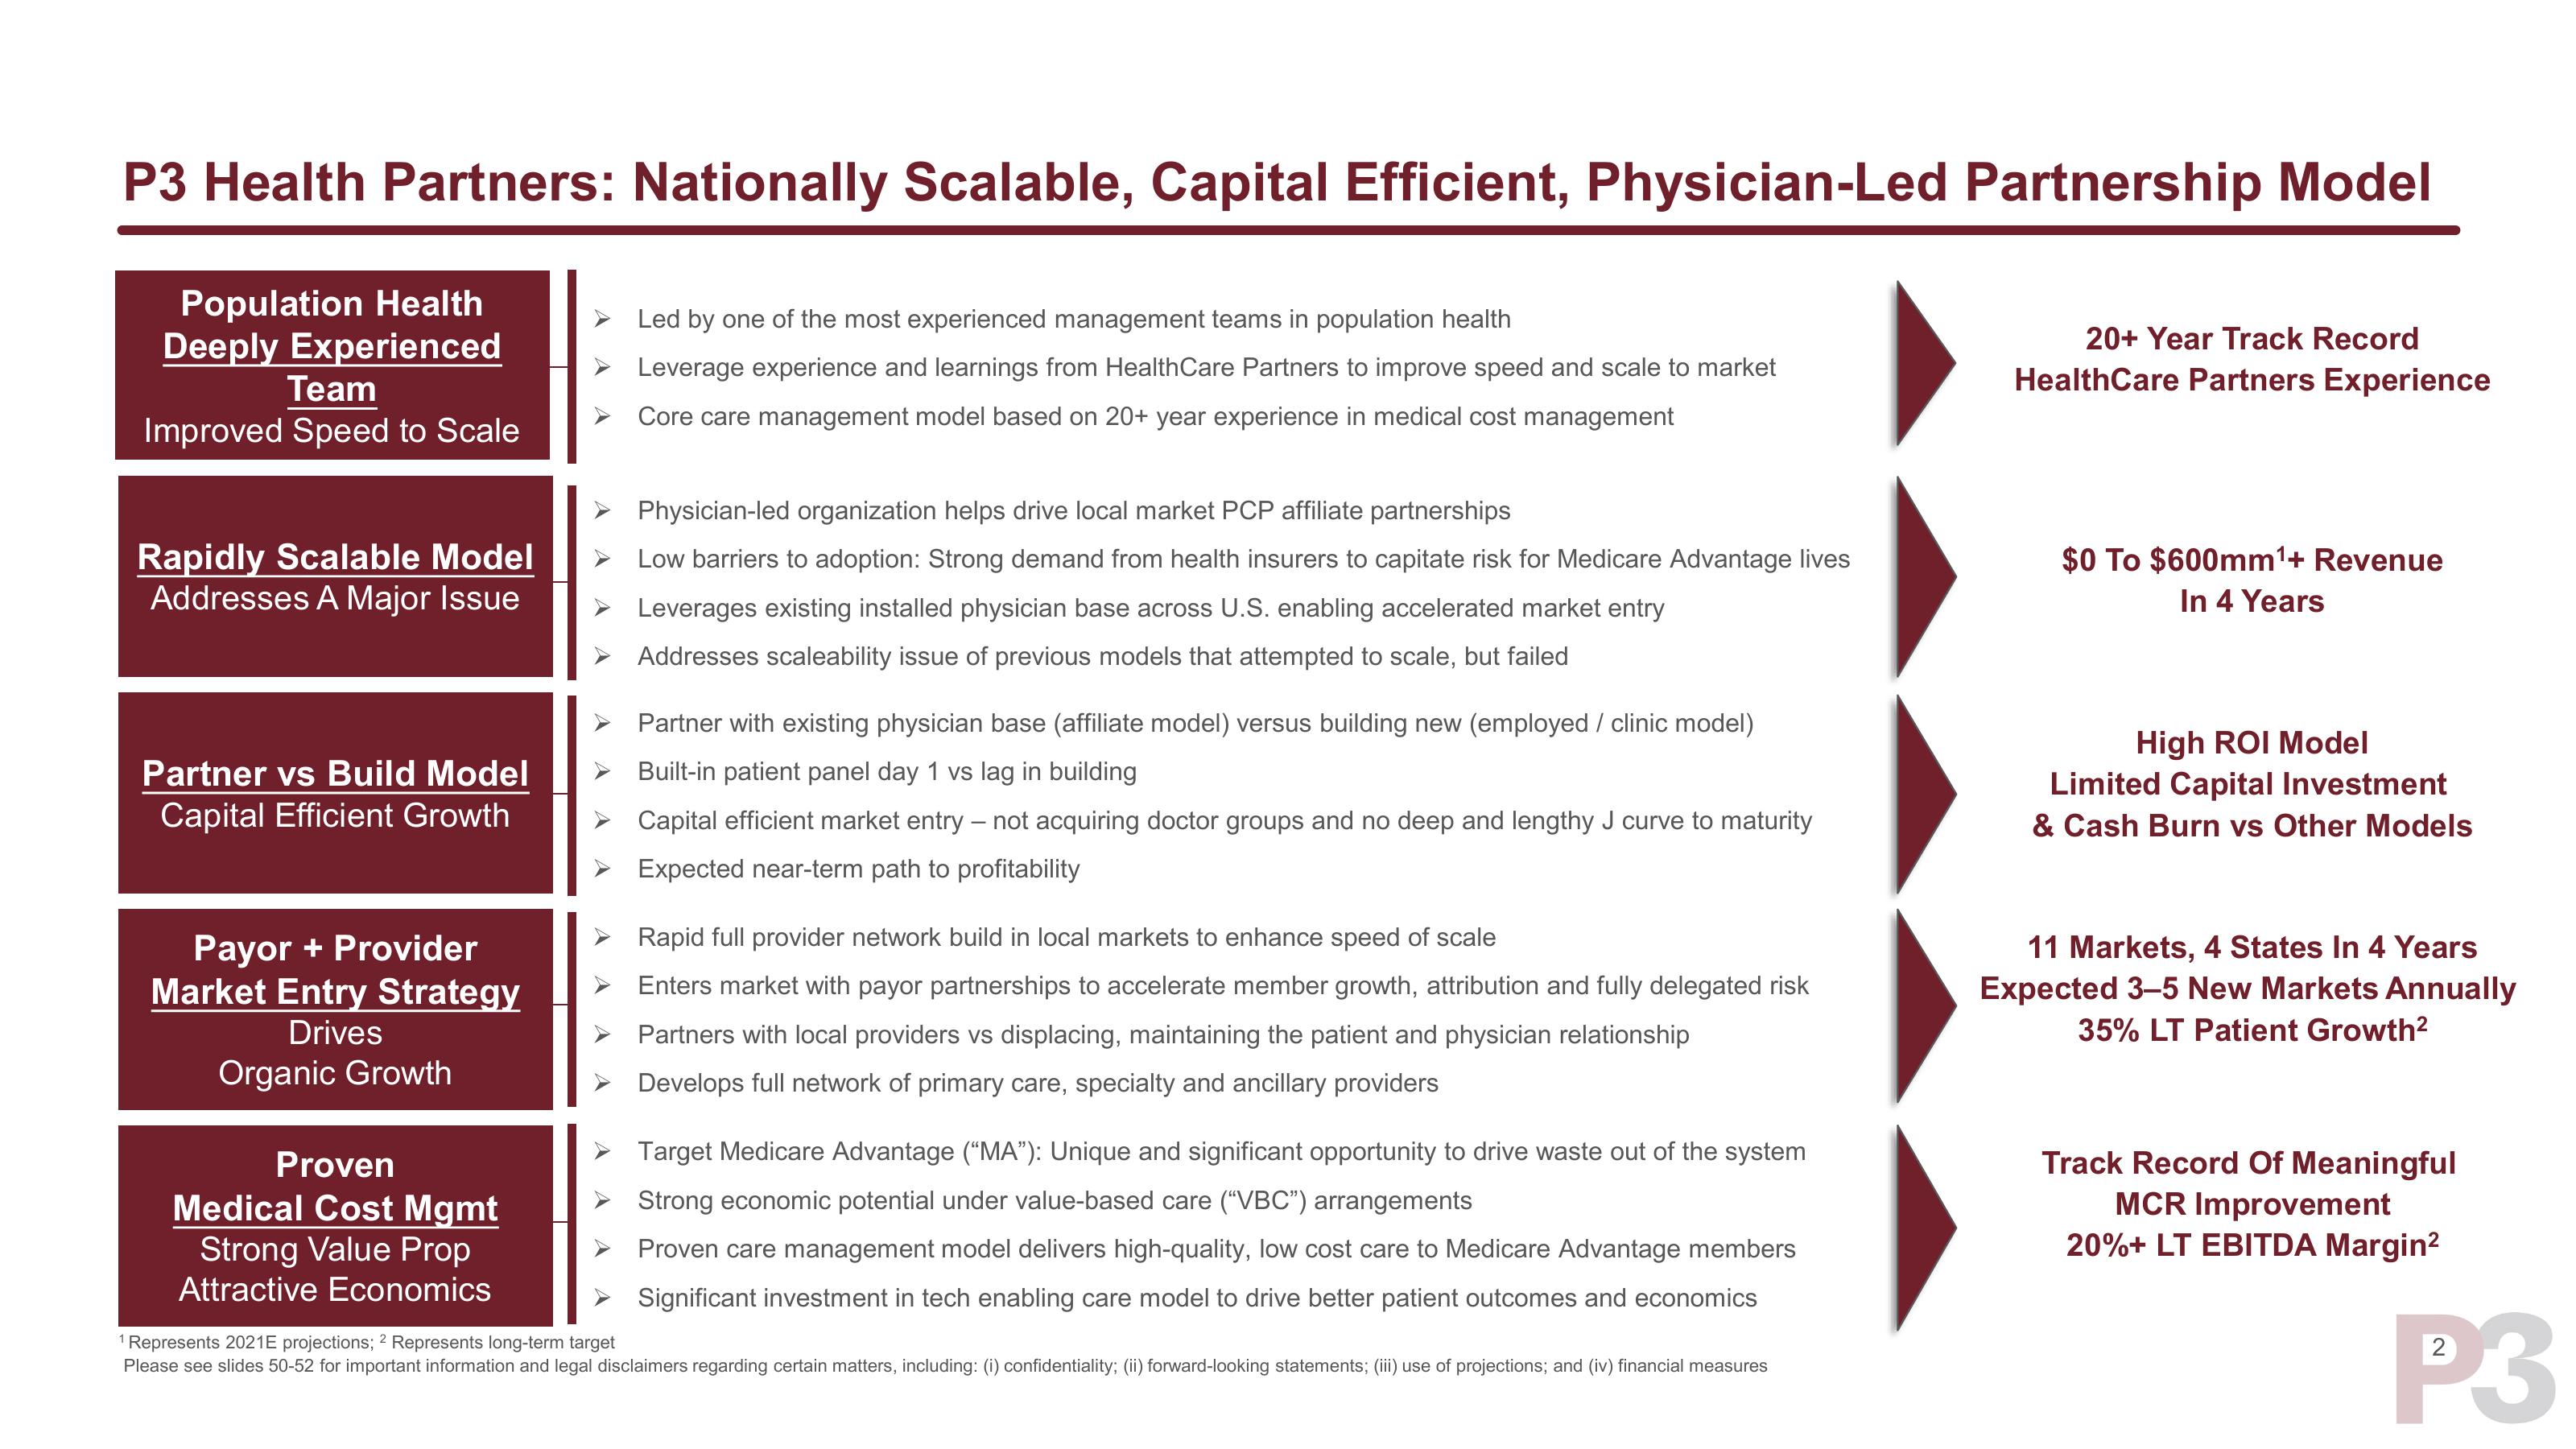
P3 Health Partners: Nationally Scalable, Capital Efficient, Physician-Led Partnership Model
Population Health
Deeply Experienced
Team
Improved Speed to Scale
Rapidly Scalable Model
Addresses A Major Issue
Partner vs Build Model
Capital Efficient Growth
Payor + Provider
Market Entry Strategy
Drives
Organic Growth
Proven
Medical Cost Mgmt
Strong Value Prop
Attractive Economics
Led by one of the most experienced management teams in population health
Leverage experience and learnings from Health Care Partners to improve speed and scale to market
Core care management model based on 20+ year experience in medical cost management
Physician-led organization helps drive local market PCP affiliate partnerships
Low barriers to adoption: Strong demand from health insurers to capitate risk for Medicare Advantage lives
➤ Leverages existing installed physician base across U.S. enabling accelerated market entry
Addresses scaleability issue of previous models that attempted to scale, but failed
Partner with existing physician base (affiliate model) versus building new (employed / clinic model)
Built-in patient panel day 1 vs lag in building
Capital efficient market entry - not acquiring doctor groups and no deep and lengthy J curve to maturity
Expected near-term path to profitability
Rapid full provider network build in local markets to enhance speed of scale
Enters market with payor partnerships to accelerate member growth, attribution and fully delegated risk
Partners with local providers vs displacing, maintaining the patient and physician relationship
Develops full network of primary care, specialty and ancillary providers
Target Medicare Advantage ("MA"): Unique and significant opportunity to drive waste out of the system
Strong economic potential under value-based care ("VBC") arrangements
Proven care management model delivers high-quality, low cost care to Medicare Advantage members
Significant investment in tech enabling care model to drive better patient outcomes and economics
¹ Represents 2021E projections; 2 Represents long-term target
Please see slides 50-52 for important information and legal disclaimers regarding certain matters, including: (i) confidentiality; (ii) forward-looking statements; (iii) use of projections; and (iv) financial measures
20+ Year Track Record
HealthCare Partners Experience
$0 To $600mm¹+ Revenue
In 4 Years
High ROI Model
Limited Capital Investment
& Cash Burn vs Other Models
11 Markets, 4 States In 4 Years
Expected 3-5 New Markets Annually
35% LT Patient Growth²
Track Record Of Meaningful
MCR Improvement
20%+ LT EBITDA Margin²
P3View entire presentation