Investor Presentation
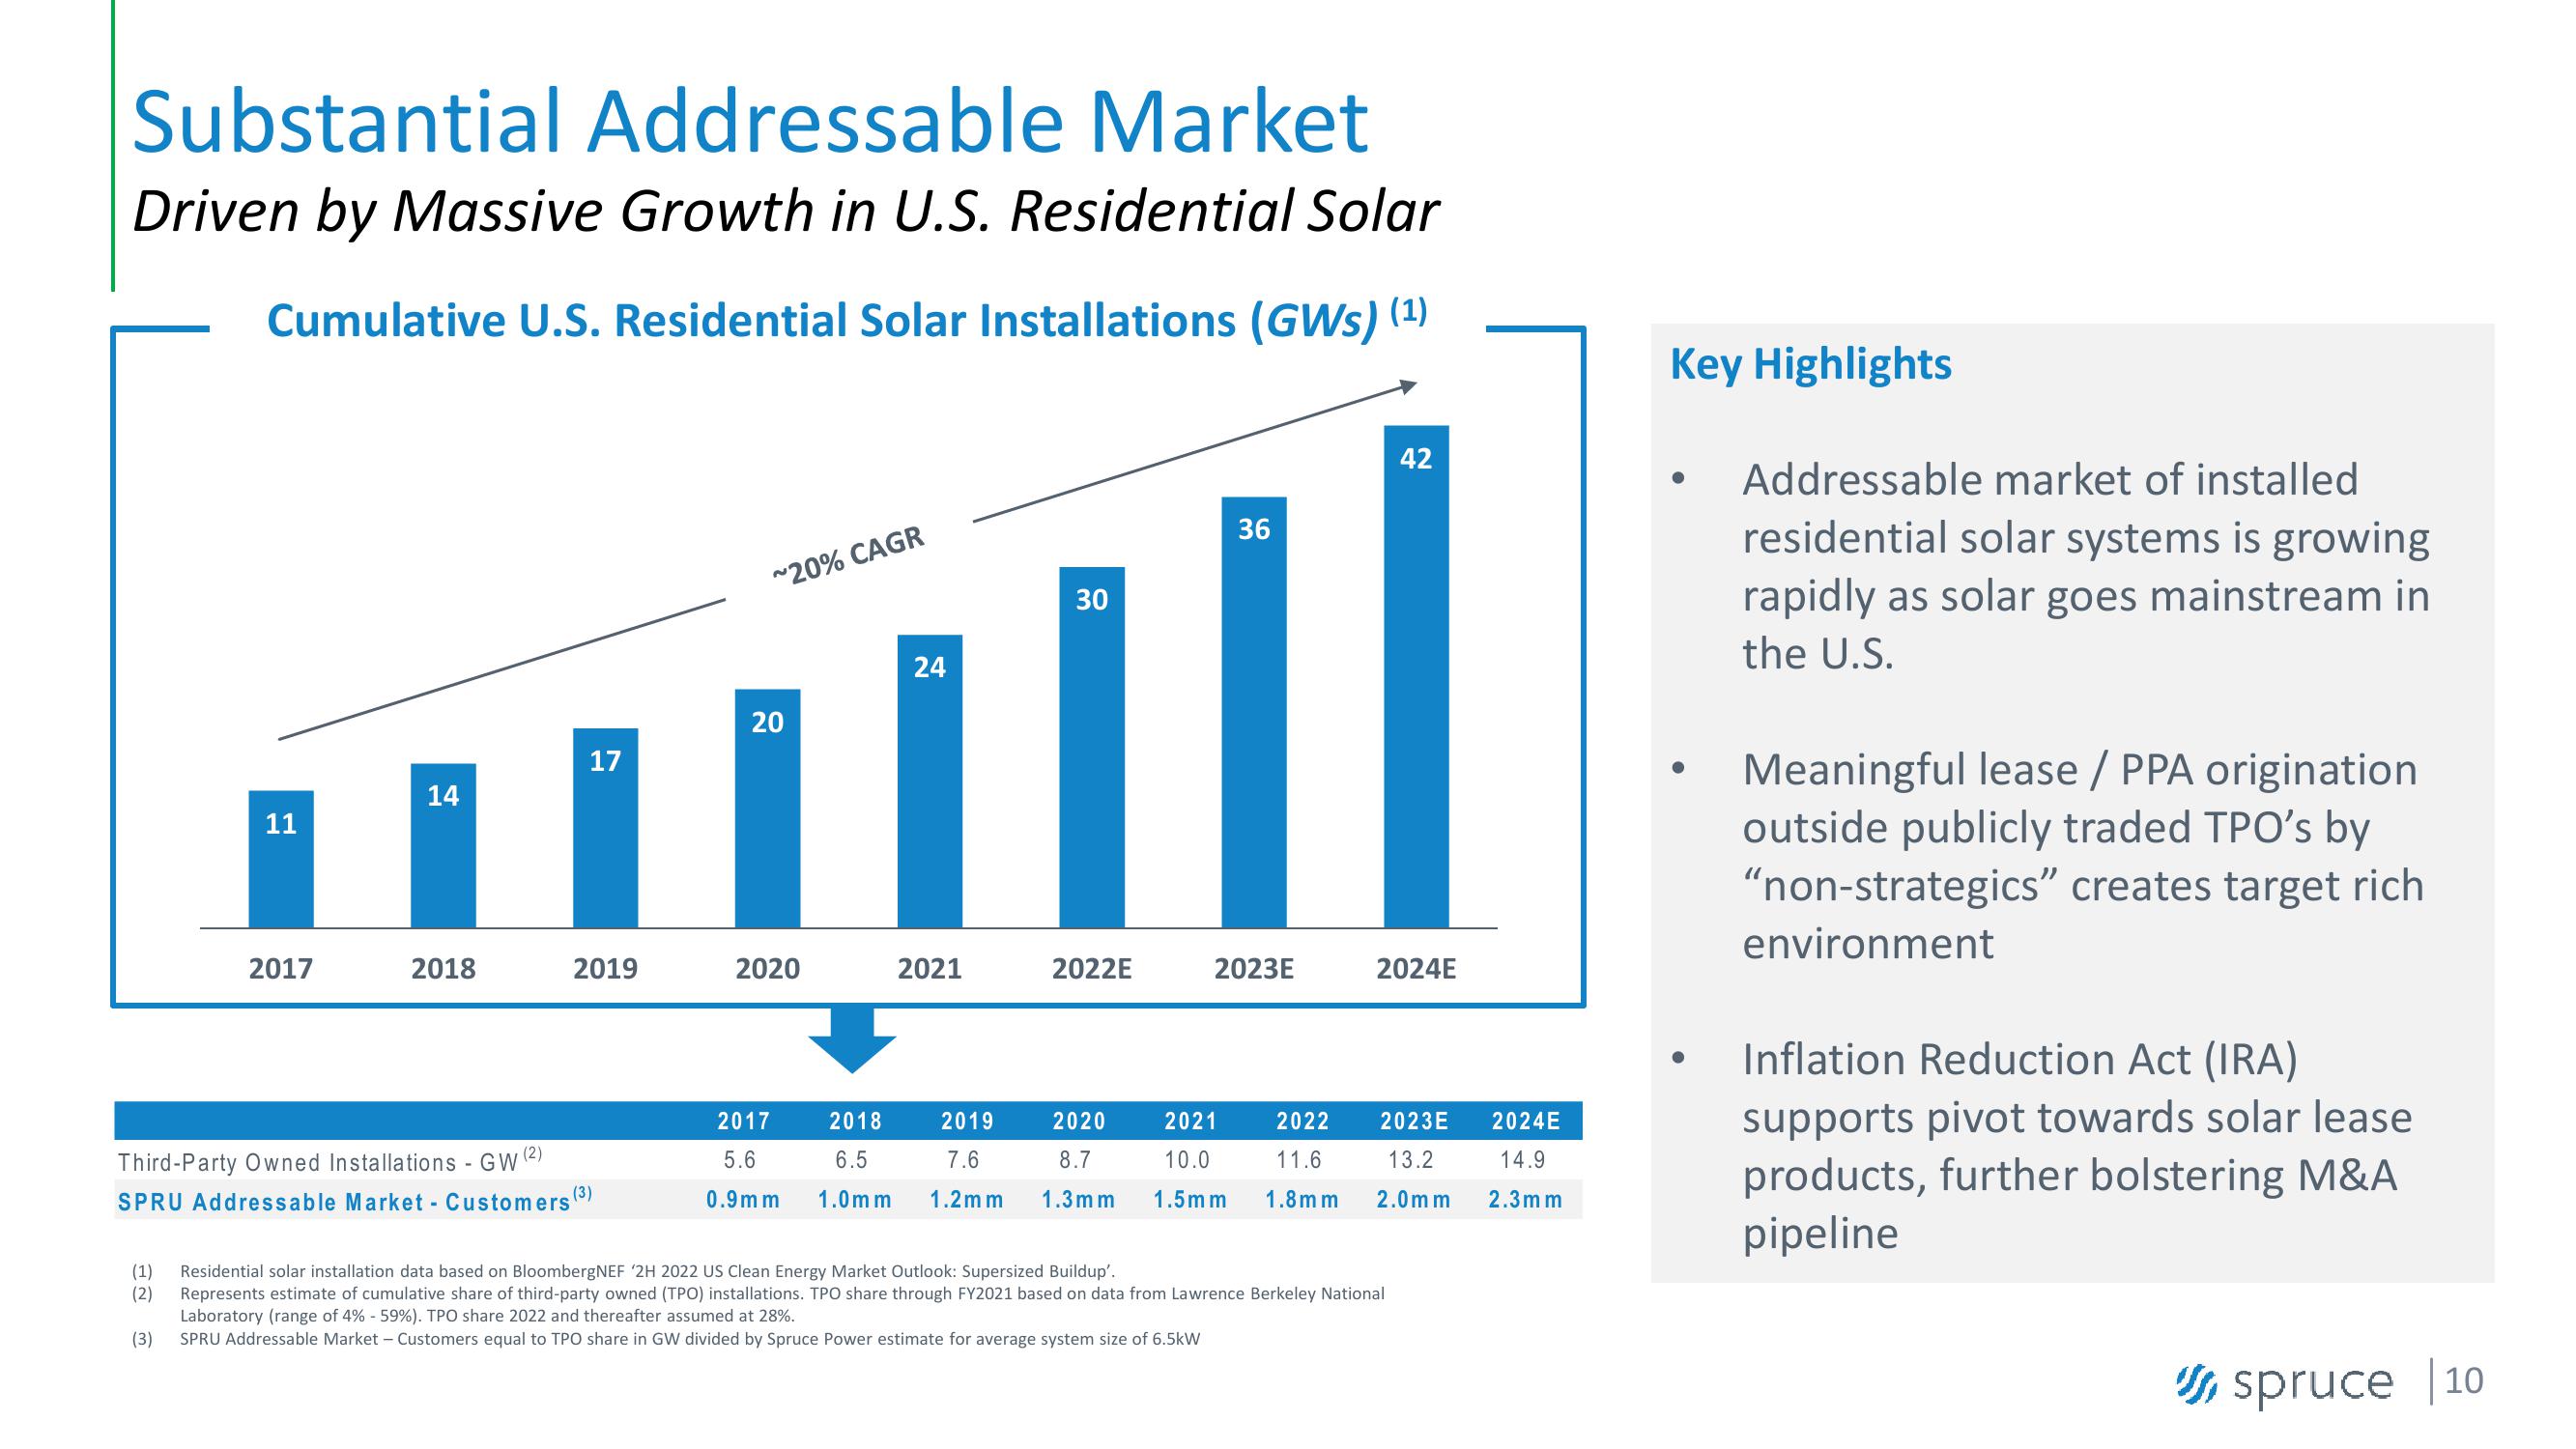
Substantial Addressable Market
Driven by Massive Growth in U.S. Residential Solar
Cumulative U.S. Residential Solar Installations (GWs) (1)
14
11
1
17
20
~20% CAGR
24
30
36
20
42
42
2017
2018
2019
2020
2021
2022E
2023E
2024E
2017
2018
2019
2020
2021
2022
Third-Party Owned Installations - GW
(2)
5.6
6.5
(3)
SPRU Addressable Market Customers
0.9mm
1.0mm
7.6
1.2mm 1.3mm
8.7
10.0
11.6
2023E
13.2
2024E
14.9
1.5mm
1.8mm
2.0mm
2.3mm
Key Highlights
Addressable market of installed
residential solar systems is growing
rapidly as solar goes mainstream in
the U.S.
Meaningful lease/ PPA origination
outside publicly traded TPO's by
"non-strategics" creates target rich
environment
Inflation Reduction Act (IRA)
supports pivot towards solar lease
products, further bolstering M&A
pipeline
(1) Residential solar installation data based on BloombergNEF '2H 2022 US Clean Energy Market Outlook: Supersized Buildup'.
(2) Represents estimate of cumulative share of third-party owned (TPO) installations. TPO share through FY2021 based on data from Lawrence Berkeley National
Laboratory (range of 4% -59%). TPO share 2022 and thereafter assumed at 28%.
(3)
SPRU Addressable Market - Customers equal to TPO share in GW divided by Spruce Power estimate for average system size of 6.5kW
spruce 10View entire presentation