Jefferies Financial Group Investor Day Presentation Deck
Competitive Positioning
Evidence that Our Curve is Shifting
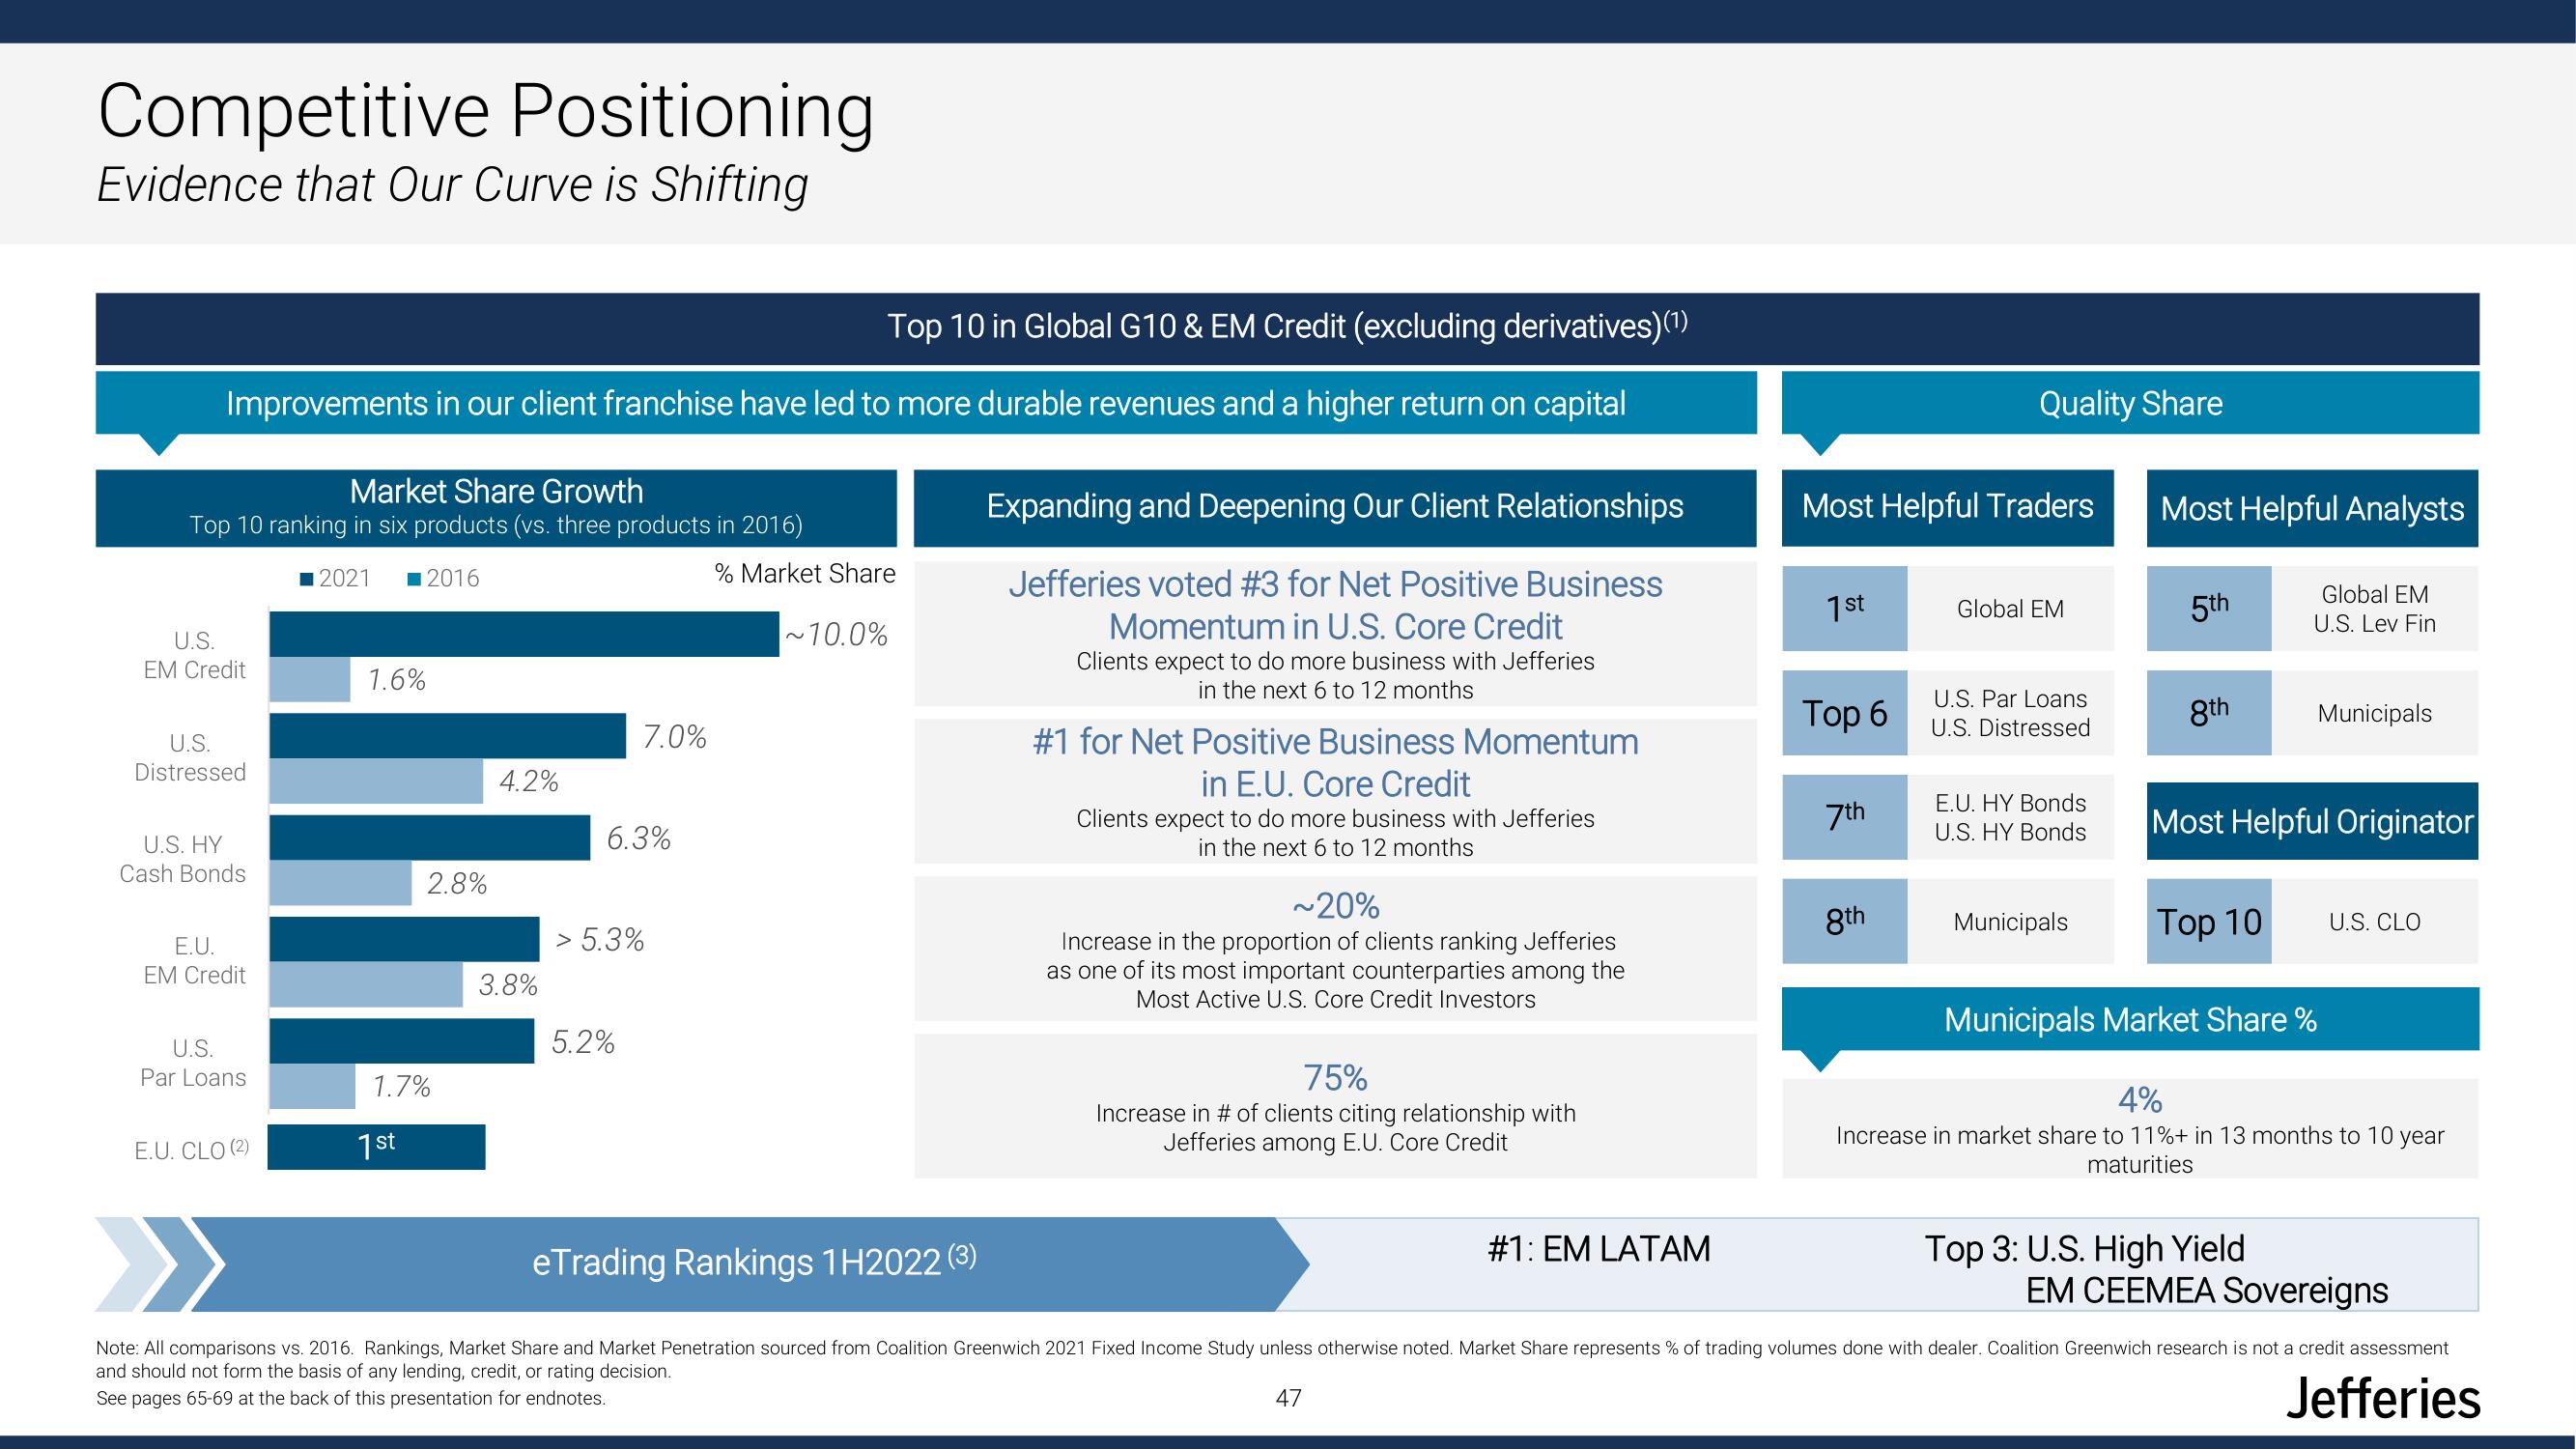
Top 10 in Global G10 & EM Credit (excluding derivatives) (1)
Improvements in our client franchise have led to more durable revenues and a higher return on capital
Market Share Growth
Top 10 ranking in six products (vs. three products in 2016)
2021 ■2016
U.S.
EM Credit
U.S.
Distressed
U.S. HY
Cash Bonds
E.U.
EM Credit
U.S.
Par Loans
E.U. CLO (2)
1.6%
2.8%
1.7%
1st
4.2%
3.8%
7.0%
6.3%
> 5.3%
5.2%
% Market Share
~10.0%
Expanding and Deepening Our Client Relationships
Jefferies voted #3 for Net Positive Business
Momentum in U.S. Core Credit
Clients expect to do more business with Jefferies
in the next 6 to 12 months
#1 for Net Positive Business Momentum
in E.U. Core Credit
Clients expect to do more business with Jefferies
in the next 6 to 12 months
~20%
Increase in the proportion of clients ranking Jefferies
as one of its most important counterparties among the
Most Active U.S. Core Credit Investors
75%
Increase in # of clients citing relationship with
Jefferies among E.U. Core Credit
#1: EM LATAM
Most Helpful Traders
1st
Top 6
7th
Quality Share
8th
Global EM
U.S. Par Loans
U.S. Distressed
E.U. HY Bonds
U.S. HY Bonds
Municipals
Most Helpful Analysts
5th
8th
Top 10
Global EM
U.S. Lev Fin
Most Helpful Originator
Municipals Market Share %
Municipals
Top 3: U.S. High Yield
U.S. CLO
4%
Increase in market share to 11%+ in 13 months to 10 year
maturities
eTrading Rankings 1H2022 (3)
Note: All comparisons vs. 2016. Rankings, Market Share and Market Penetration sourced from Coalition Greenwich 2021 Fixed Income Study unless otherwise noted. Market Share represents % of trading volumes done with dealer. Coalition Greenwich research is not a credit assessment
and should not form the basis of any lending, credit, or rating decision.
47
See pages 65-69 at the back of this presentation for endnotes.
Jefferies
EM CEEMEA SovereignsView entire presentation