Getty SPAC Presentation Deck
Capital Structure and Cash Flow Priorities
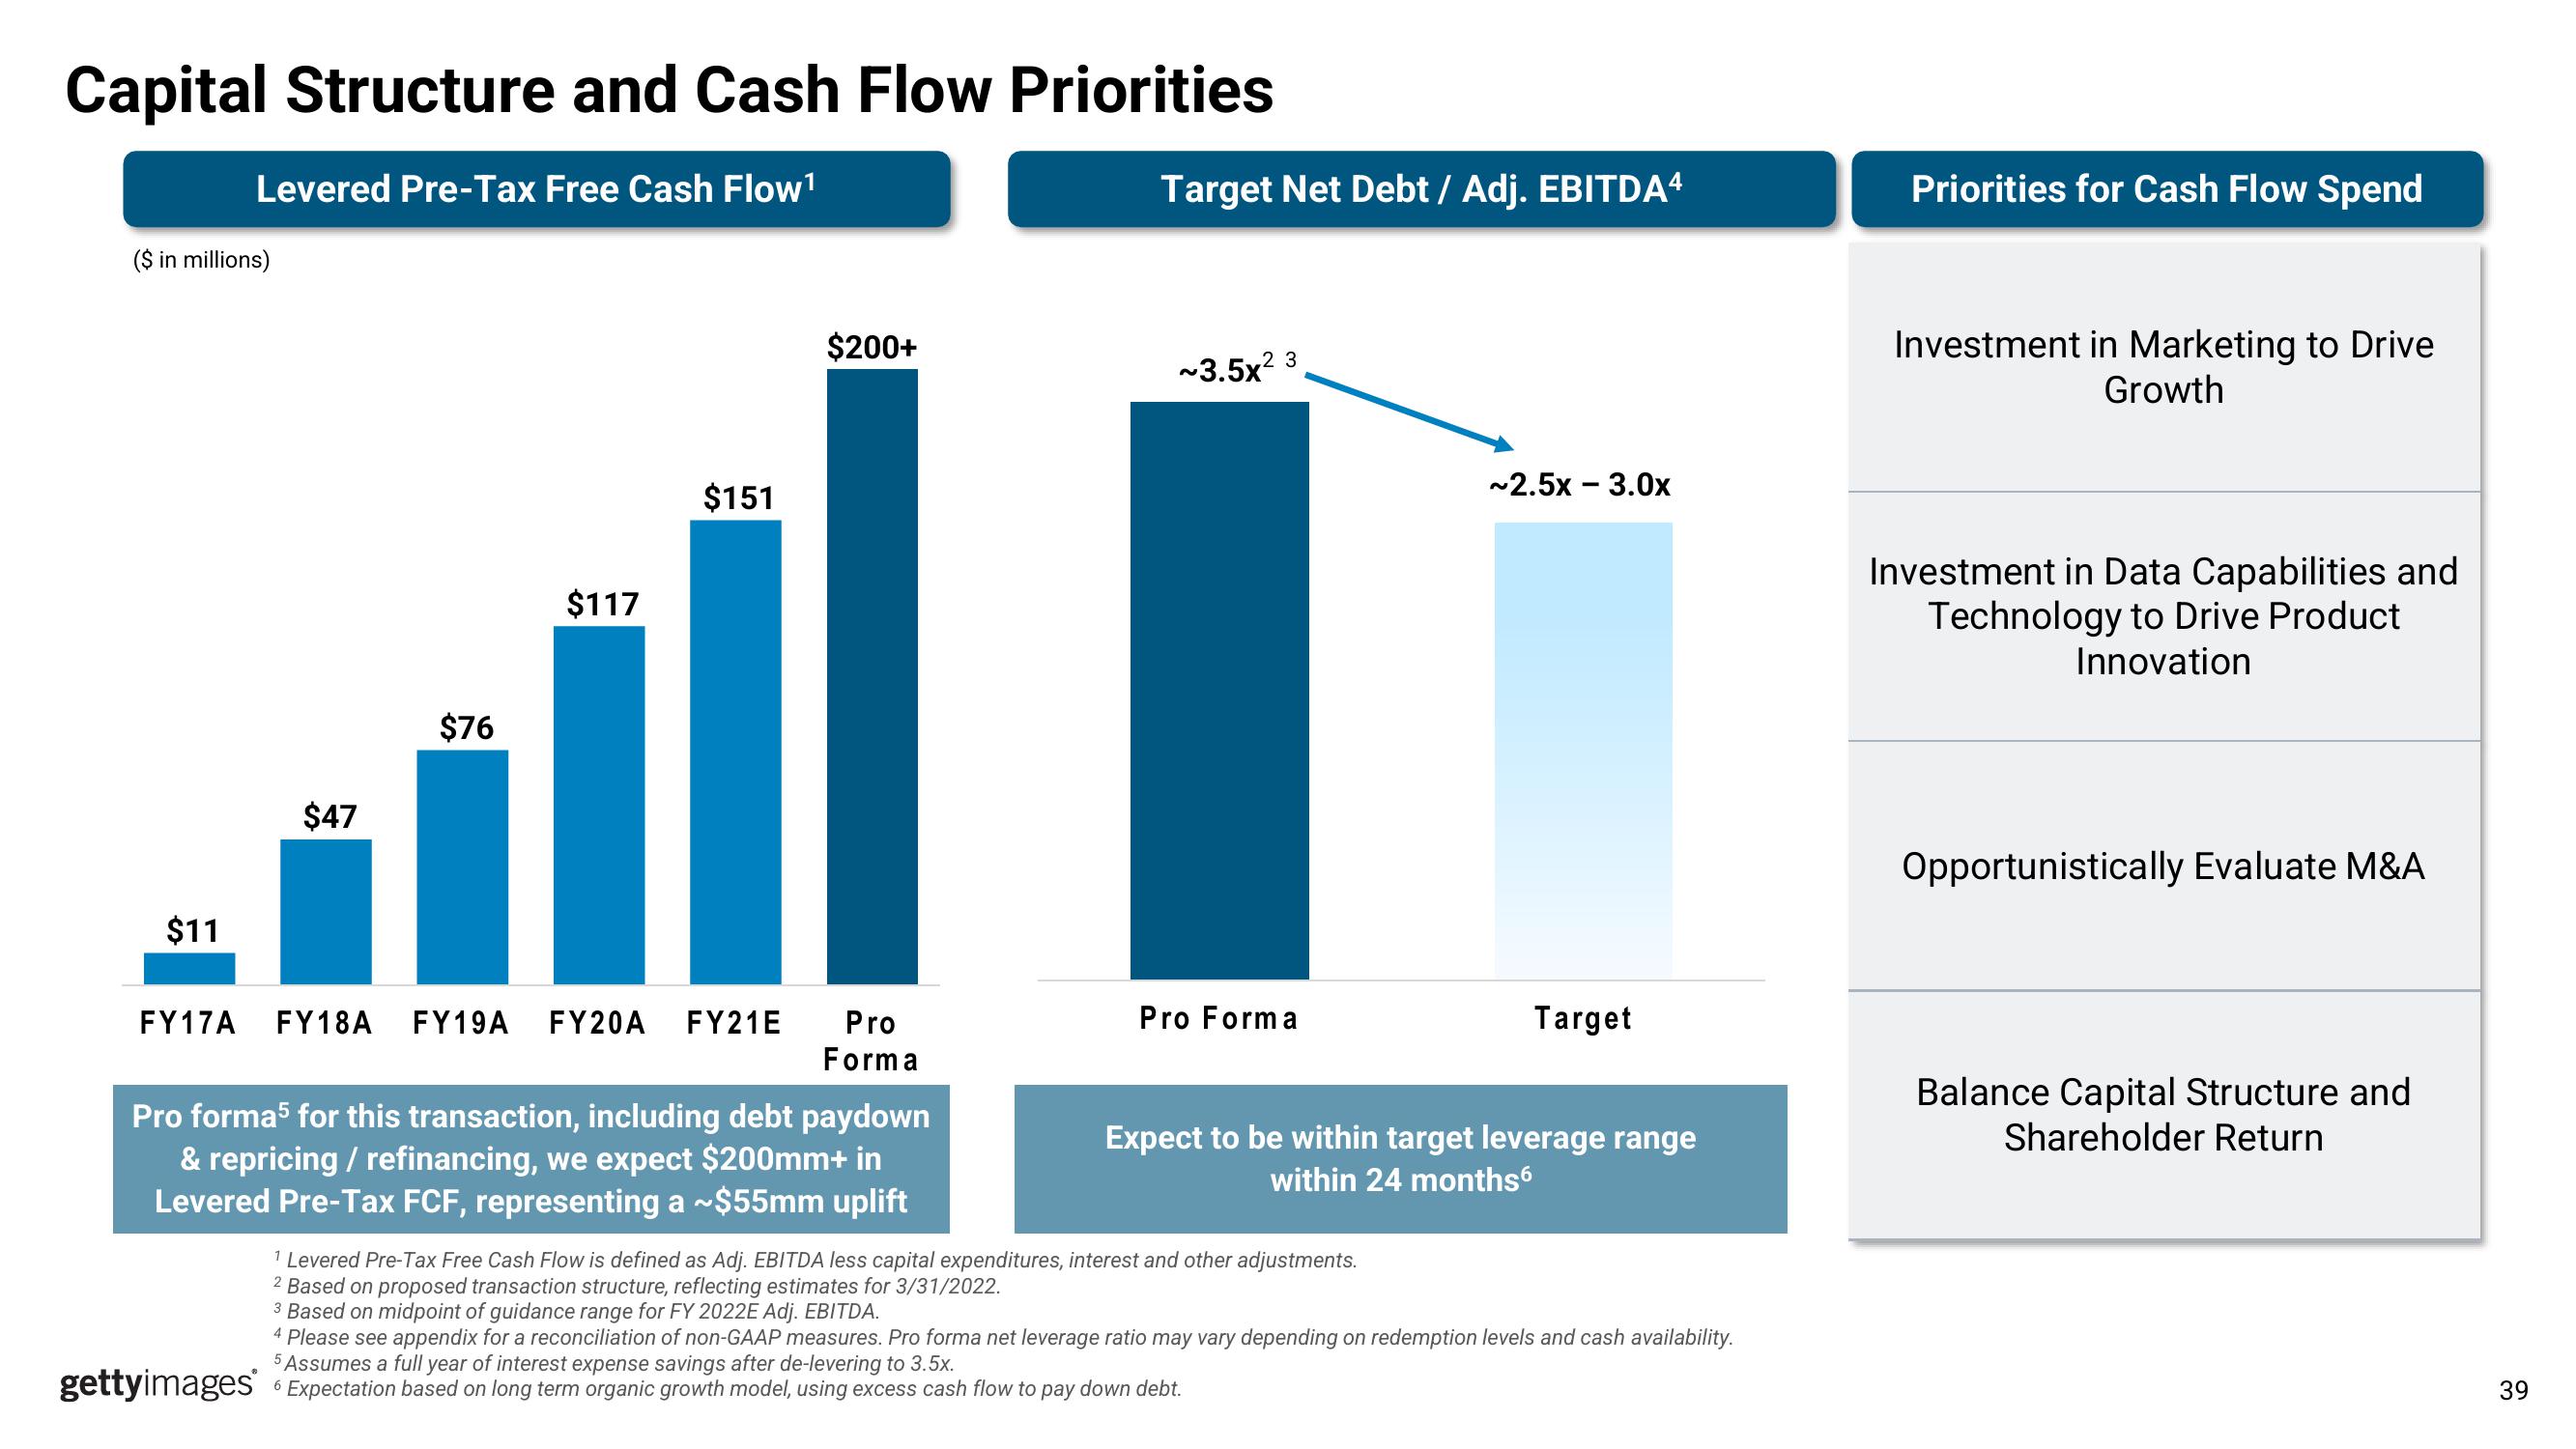
Levered Pre-Tax Free Cash Flow¹
($ in millions)
$11
$47
$76
$117
$151
FY17A FY18A FY19A FY20A FY21E
$200+
Pro
Forma
Pro forma5 for this transaction, including debt paydown
& repricing / refinancing, we expect $200mm+ in
Levered Pre-Tax FCF, representing a ~$55mm uplift
Target Net Debt / Adj. EBITDA4
~3.5x2
2 3
Pro Forma
~2.5x - 3.0x
Target
Expect to be within target leverage range
within 24 months6
¹ Levered Pre-Tax Free Cash Flow is defined as Adj. EBITDA less capital expenditures, interest and other adjustments.
2 Based on proposed transaction structure, reflecting estimates for 3/31/2022.
3 Based on midpoint of guidance range for FY 2022E Adj. EBITDA.
4 Please see appendix for a reconciliation of non-GAAP measures. Pro forma net leverage ratio may vary depending on redemption levels and cash availability.
5 Assumes a full year of interest expense savings after de-levering to 3.5x.
gettyimages Expectation based on long term organic growth model, using excess cash flow to pay down debt.
6
Priorities for Cash Flow Spend
Investment in Marketing to Drive
Growth
Investment in Data Capabilities and
Technology to Drive Product
Innovation
Opportunistically Evaluate M&A
Balance Capital Structure and
Shareholder Return
39View entire presentation