Sterling Results Presentation Deck
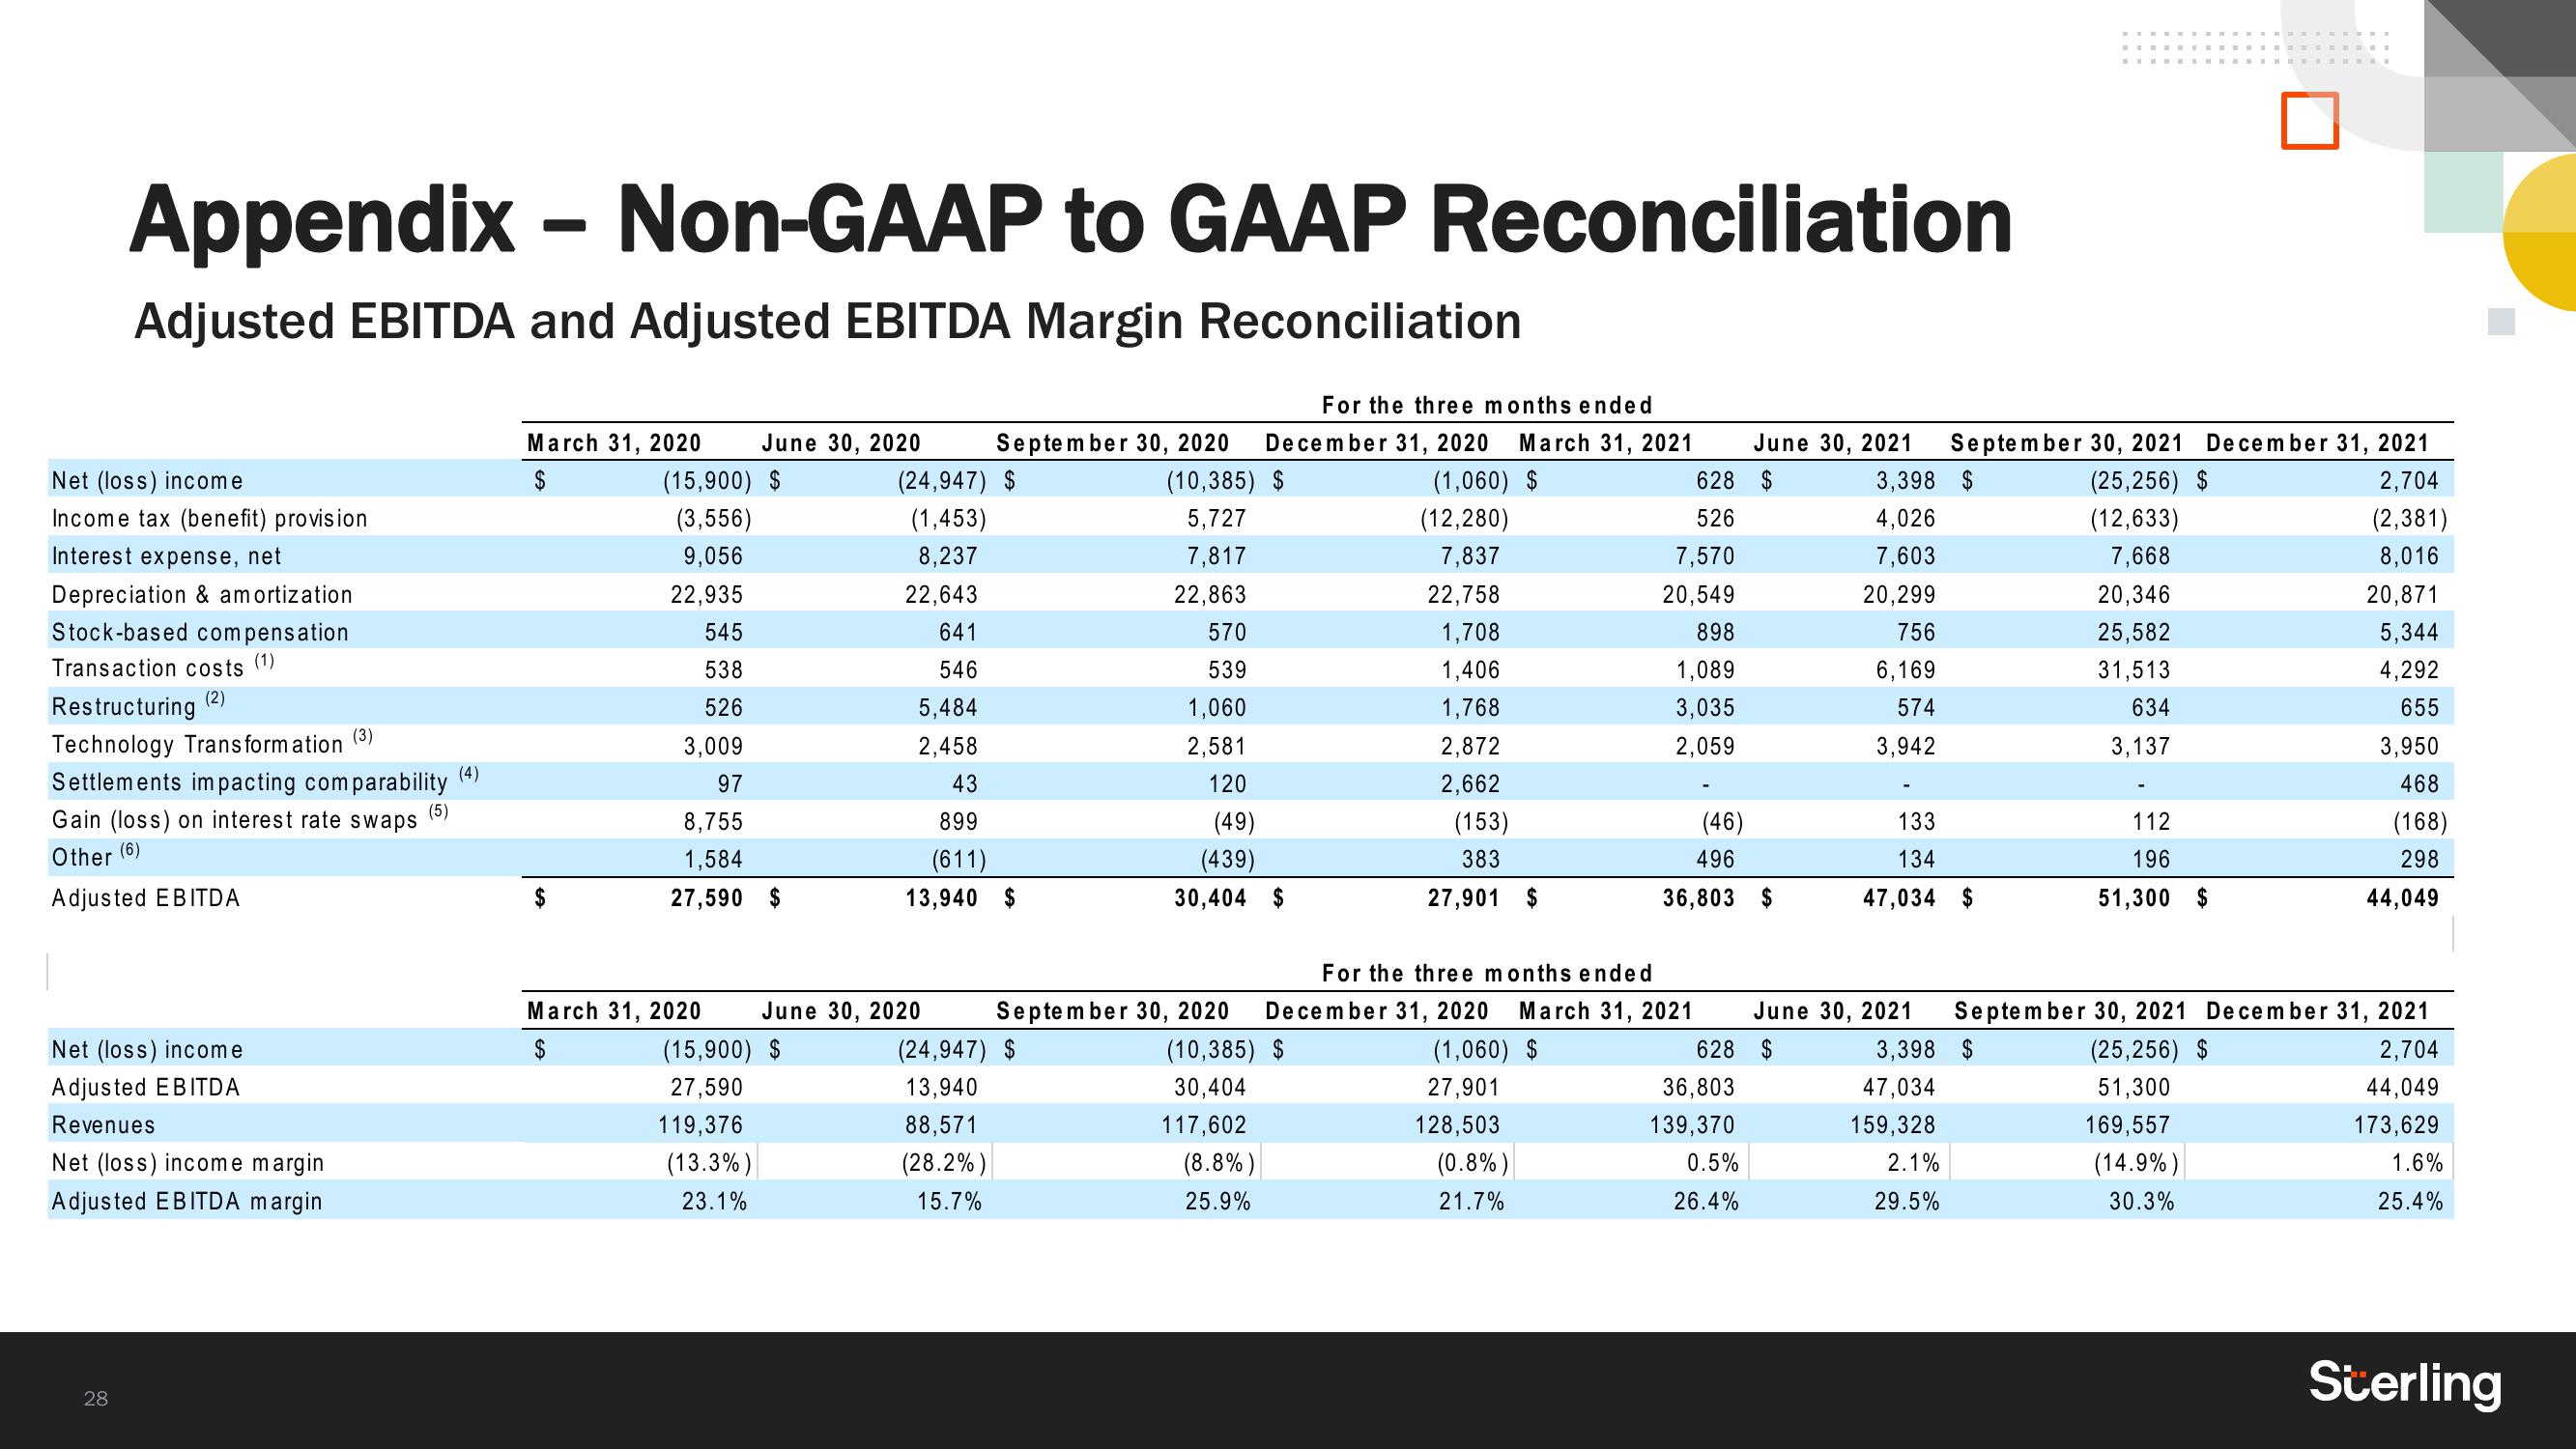
Appendix - Non-GAAP to GAAP Reconciliation
Adjusted EBITDA and Adjusted EBITDA Margin Reconciliation
Net (loss) income
Income tax (benefit) provision
Interest expense, net
Depreciation & amortization
Stock-based compensation
Transaction costs (1)
Restructuring (2)
(3)
Technology Transformation
Settlements impacting comparability
Gain (loss) on interest rate swaps
Other
(6)
Adjusted EBITDA
Net (loss) income
Adjusted EBITDA
Revenues
Net (loss) income margin
Adjusted EBITDA margin
28
(5)
(4)
March 31, 2020 June 30, 2020
$
(15,900) $
(3,556)
9,056
22,935
545
538
526
3,009
97
8,755
1,584
27,590 $
March 31, 2020
$
For the three months ended
September 30, 2020 December 31, 2020 March 31, 2021
(24,947) $
(10,385) $
(1,060) $
5,727
(1,453)
(12,280)
8,237
7,817
7,837
22,643
22,863
22,758
570
1,708
539
1,406
1,060
1,768
2,581
2,872
2,662
(15,900) $
27,590
119,376
(13.3%)
23.1%
641
546
5,484
2,458
43
899
(611)
13,940 $
June 30, 2020
120
(49)
(439)
30,404 $
September 30, 2020
(24,947) $
13,940
88,571
(28.2%)
15.7%
(10,385) $
30,404
117,602
(8.8%)
25.9%
(153)
383
27,901 $
For the three months ended
December 31, 2020 March 31, 2021
(1,060) $
27,901
128,503
June 30, 2021
628 $
526
7,570
20,549
898
1,089
3,035
2,059
(0.8%)
21.7%
(46)
496
36,803 $
0.5%
26.4%
3,398 $
4,026
7,603
20,299
756
6,169
574
3,942
June 30, 2021
628 $
36,803
139,370
September 30, 2021 December 31, 2021
(25,256) $
2,704
(12,633)
(2,381)
7,668
8,016
133
134
47,034 $
47,034
159,328
2.1%
29.5%
3,398 $
20,346
25,582
31,513
634
3,137
112
196
51,300 $
September 30, 2021 December 31, 2021
2,704
44,049
173,629
1.6%
25.4%
(25,256) $
51,300
169,557
20,871
5,344
4,292
655
(14.9%)
30.3%
3,950
468
(168)
298
44,049
SterlingView entire presentation