Orthofix Investor Presentation Deck
Proforma Non-GAAP Financial Measures
Adjusted EBITDA
Loss before income taxes
Non-GAAP adjustments
Interest expense, net
($ in millions)
Depreciation and intangible asset amortization expense
Share-based compensation expense
Foreign exchange impact and other non-operating expense/(gain)
SeaSpine merger-related expenses
Strategic investments
Acquisition-related fair value adjustments
Loss on investment securities
Legal judgments/settlements
Medical device regulation
Business interruption - COVID-19
Succession and transition charges
Spinal set instrument replacement expense
European sales and marketing organization restructuring
Total Non-GAAP adjustments
Adjusted EBITDA loss
Adjusted Gross Margin
($ in millions)
Total revenue, net
Gross profit
Add back:
Share-based compensation expense
SeaSpine merger-related costs
Strategic investments
Acquisition-related fair value adjustments
Amortization/depreciation of acquired long-lived assets
Medical device regulation
Adjusted gross profit
Q2 22 (Proforma)
NewCo
OFIX
SPNE
3.042 $ (15.094) $ (12.052)
$
$
$
$
0.407 $
6.512
4.460
2.991
$
1.824
(10.714)
0.123
0.148
2.246
0.316
0.068
1.814
(10.631)
0.123
0.148
2.246
0.316
0.068
1.665
0.127
8.381 $10.420 $ 18.801
11.423 $ (4.674) $
6.749
0.293 $
4.295
3.701
0.266
0.204
(0.010)
0.083
Q2 22 (Proforma)
0.566
1.665
0.127
OFIX
SPNE
NewCo
$118.070 $ 56.942 $ 175.012
$86.470 $ 35.768 $ 122.238 (1)
0.700
10.807
8.161
3.257
0.082
0.083
0.286
0.566
0.083
0.008
123.181
Q2 23
Q2 22 Change
$ (37.918) $ (12.052) $ (25.866)
$
1.266 $
13.327
13.246
(0.269)
8.206
0.309
8.149
1.291
2.050
0.262
NewCo
0.008
87.248 $ 35.933 $
73.9%
63.1%
70.4%
71.6%
Adjusted gross margin (Adjusted gross profit / Total revenue, net)
(1) SeaSpine gross profit reflects reclassifications of certain expenses to conform to Orthofix presentation. ©2023 Orthofix Medical Inc. All rights reserved | 20
0.482 $
3.783
0.028
8.146
0.544
0.041
$133.878
0.700 $
10.807
8.161
3.257
1.814
(10.631)
0.123
0.148
2.246
0.316
0.068
1.665
0.127
$ 47.837 $18.801 $29.036
$ 9.919 $ 6.749 $ 3.170
NewCo
Q2 23
Q2 22
$187.016 $ 175.012 $
$120.854 $ 122.238 $
0.286 $
0.566
0.083
Change
12.004
0.566
2.520
5.085
(3.526)
8.206
(1.505)
18.780
(0.123)
1.143
(0.196)
(0.316)
0.194
For further information on the reasons for and nature of non-
(1.665) GAAP disclosures by Orthofix and descriptions of the
(0.127)
adjustments used to calculate those non-GAAP financial
measures, please see the Company's Current Report on Form 8
K filed on August 8, 2023.
0.008
$ 123.181 $
70.4%
(1.384)
0.196
3.783
(0.538)
8.063
0.544
0.033
10.697
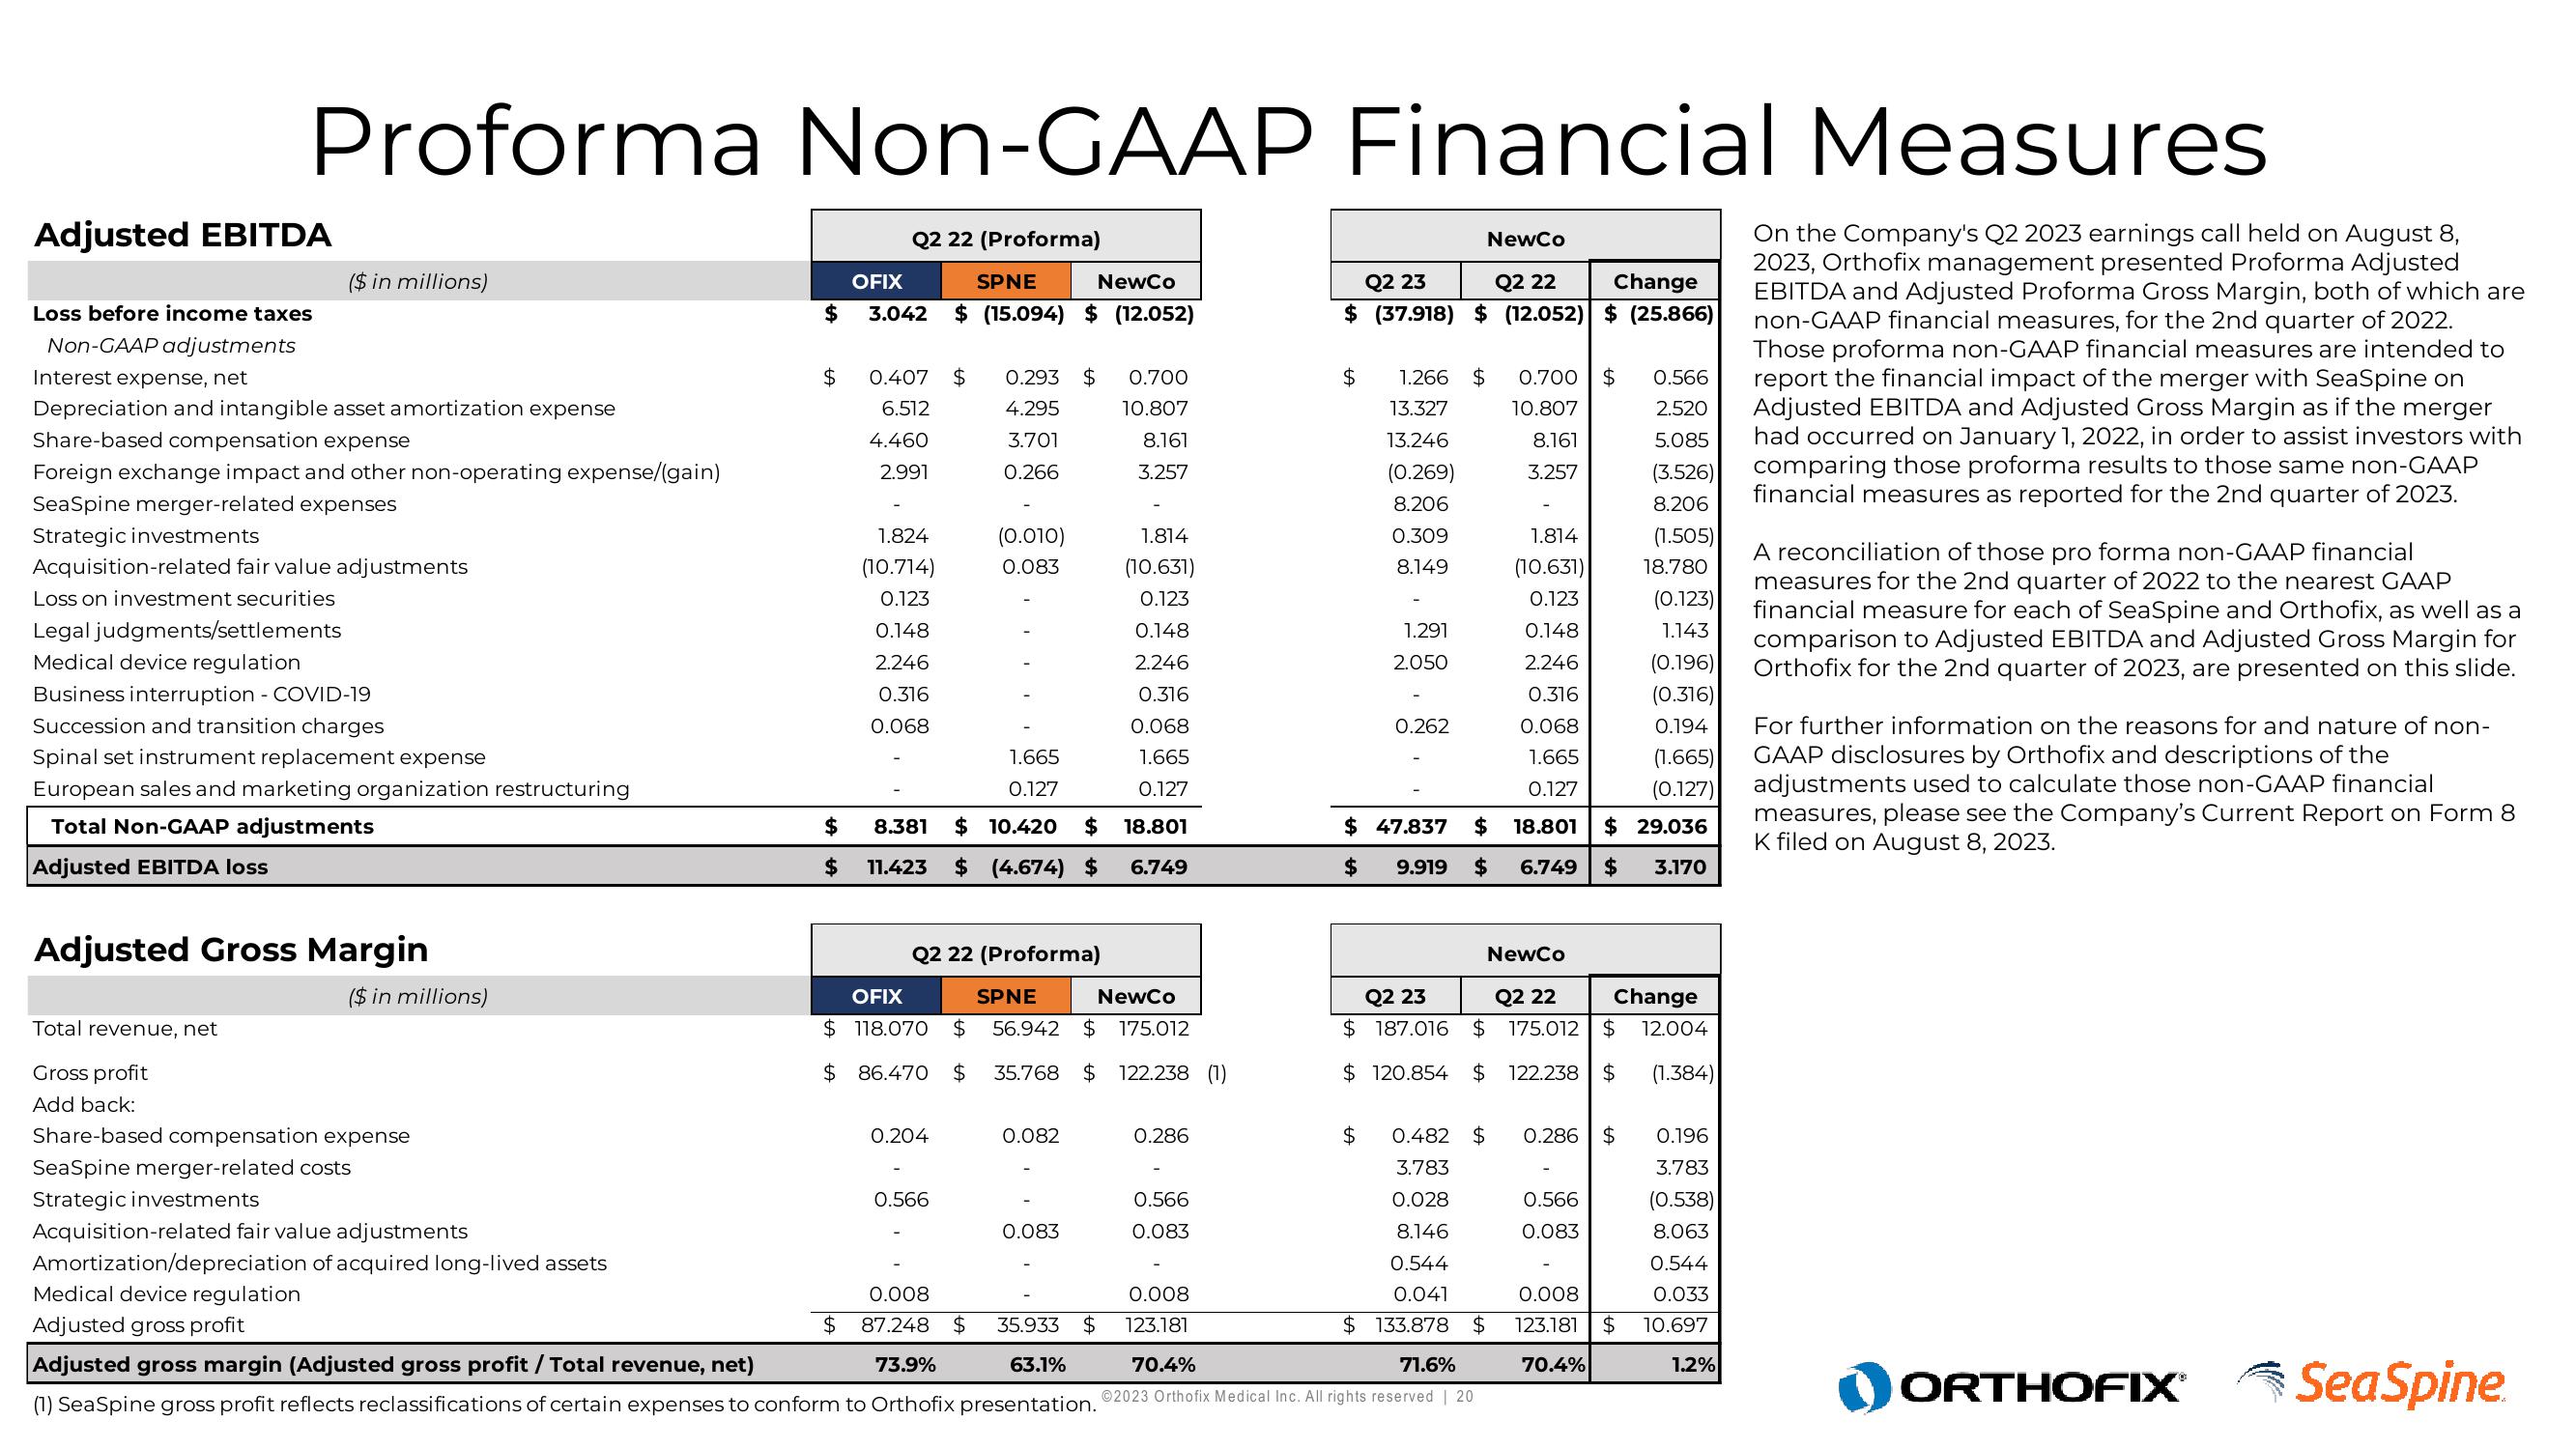
On the Company's Q2 2023 earnings call held on August 8,
2023, Orthofix management presented Proforma Adjusted
EBITDA and Adjusted Proforma Gross Margin, both of which are
non-GAAP financial measures, for the 2nd quarter of 2022.
Those proforma non-GAAP financial measures are intended to
report the financial impact of the merger with SeaSpine on
Adjusted EBITDA and Adjusted Gross Margin as if the merger
had occurred on January 1, 2022, in order to assist investors with
comparing those proforma results to those same non-GAAP
financial measures as reported for the 2nd quarter of 2023.
1.2%
A reconciliation of those pro forma non-GAAP financial
measures for the 2nd quarter of 2022 to the nearest GAAP
financial measure for each of SeaSpine and Orthofix, as well as a
comparison to Adjusted EBITDA and Adjusted Gross Margin for
Orthofix for the 2nd quarter of 2023, are presented on this slide.
ORTHOFIX® Sea SpineView entire presentation