Rightmove Results Presentation Deck
33
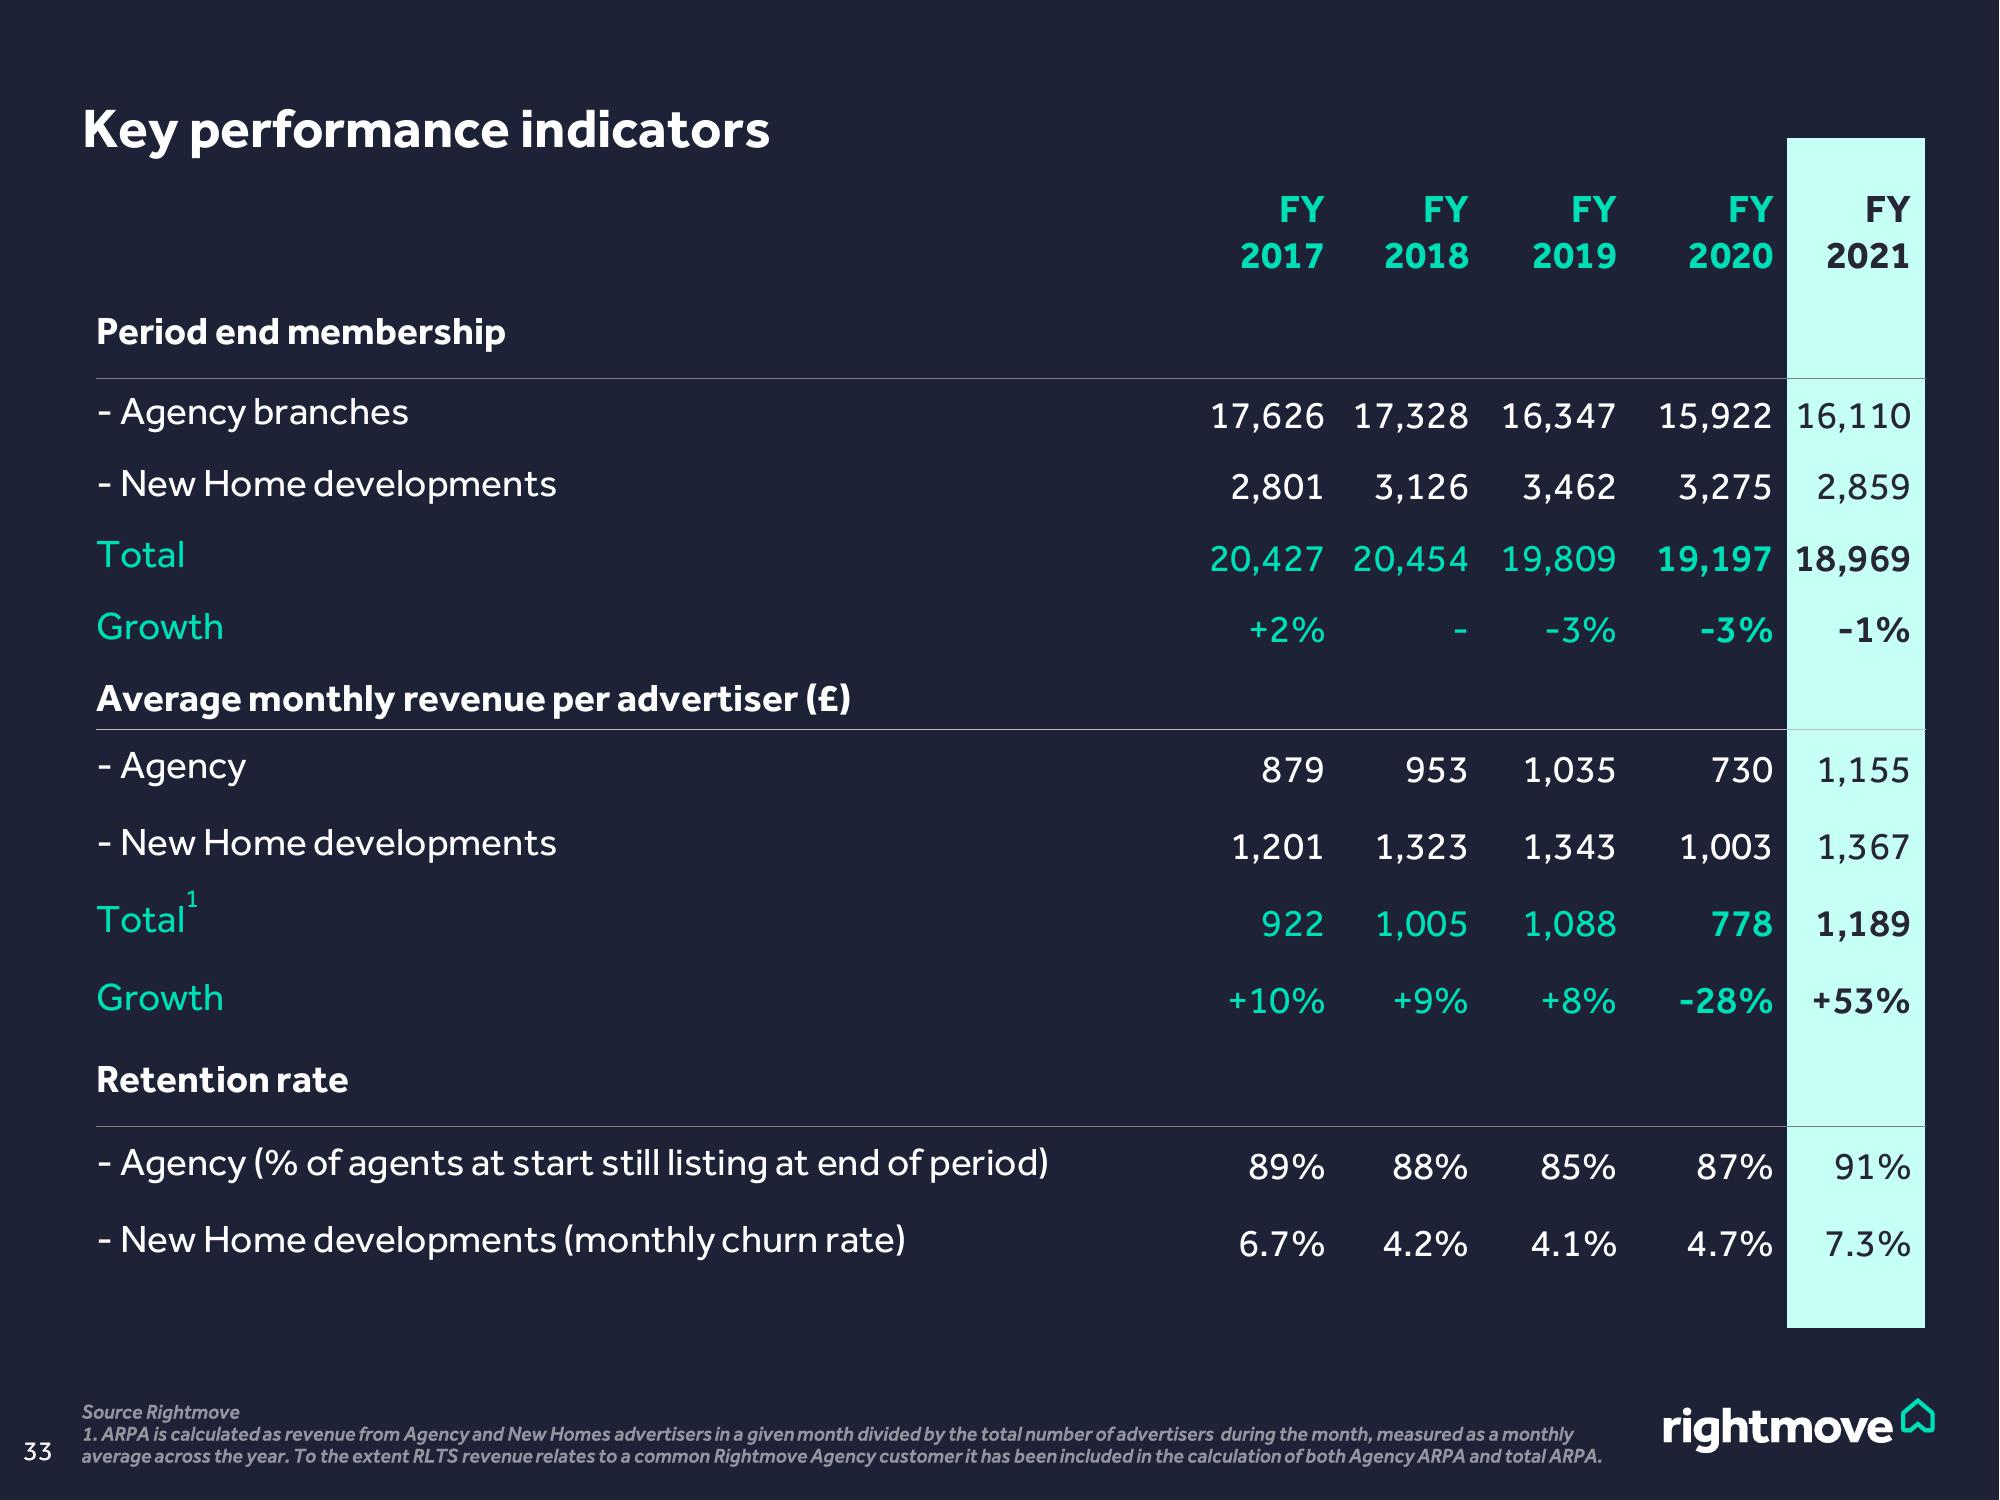
Key performance indicators
Period end membership
- Agency branches
- New Home developments
Total
Growth
Average monthly revenue per advertiser (£)
- Agency
- New Home developments
Total¹
Growth
Retention rate
- Agency (% of agents at start still listing at end of period)
- New Home developments (monthly churn rate)
FY
2017
879
1,201
17,626 17,328 16,347 15,922 16,110
2,801 3,126 3,462
3,275 2,859
19,197 18,969
20,427 20,454 19,809
+2%
-3%
-3% -1%
922
FY
FY
2018 2019
+10%
953
1,035
1,323 1,343
1,005 1,088
+9%
89% 88%
6.7% 4.2%
85%
FY
FY
2020 2021
1,155
1,003
1,367
778
1,189
+8% -28% +53%
4.1%
Source Rightmove
1.ARPA is calculated as revenue from Agency and New Homes advertisers in a given month divided by the total number of advertisers during the month, measured as a monthly
average across the year. To the extent RLTS revenue relates to a common Rightmove Agency customer it has been included in the calculation of both Agency ARPA and total ARPA.
730
87% 91%
7.3%
4.7%
rightmoveView entire presentation