Cyxtera Results Presentation Deck
FY 2021 Results
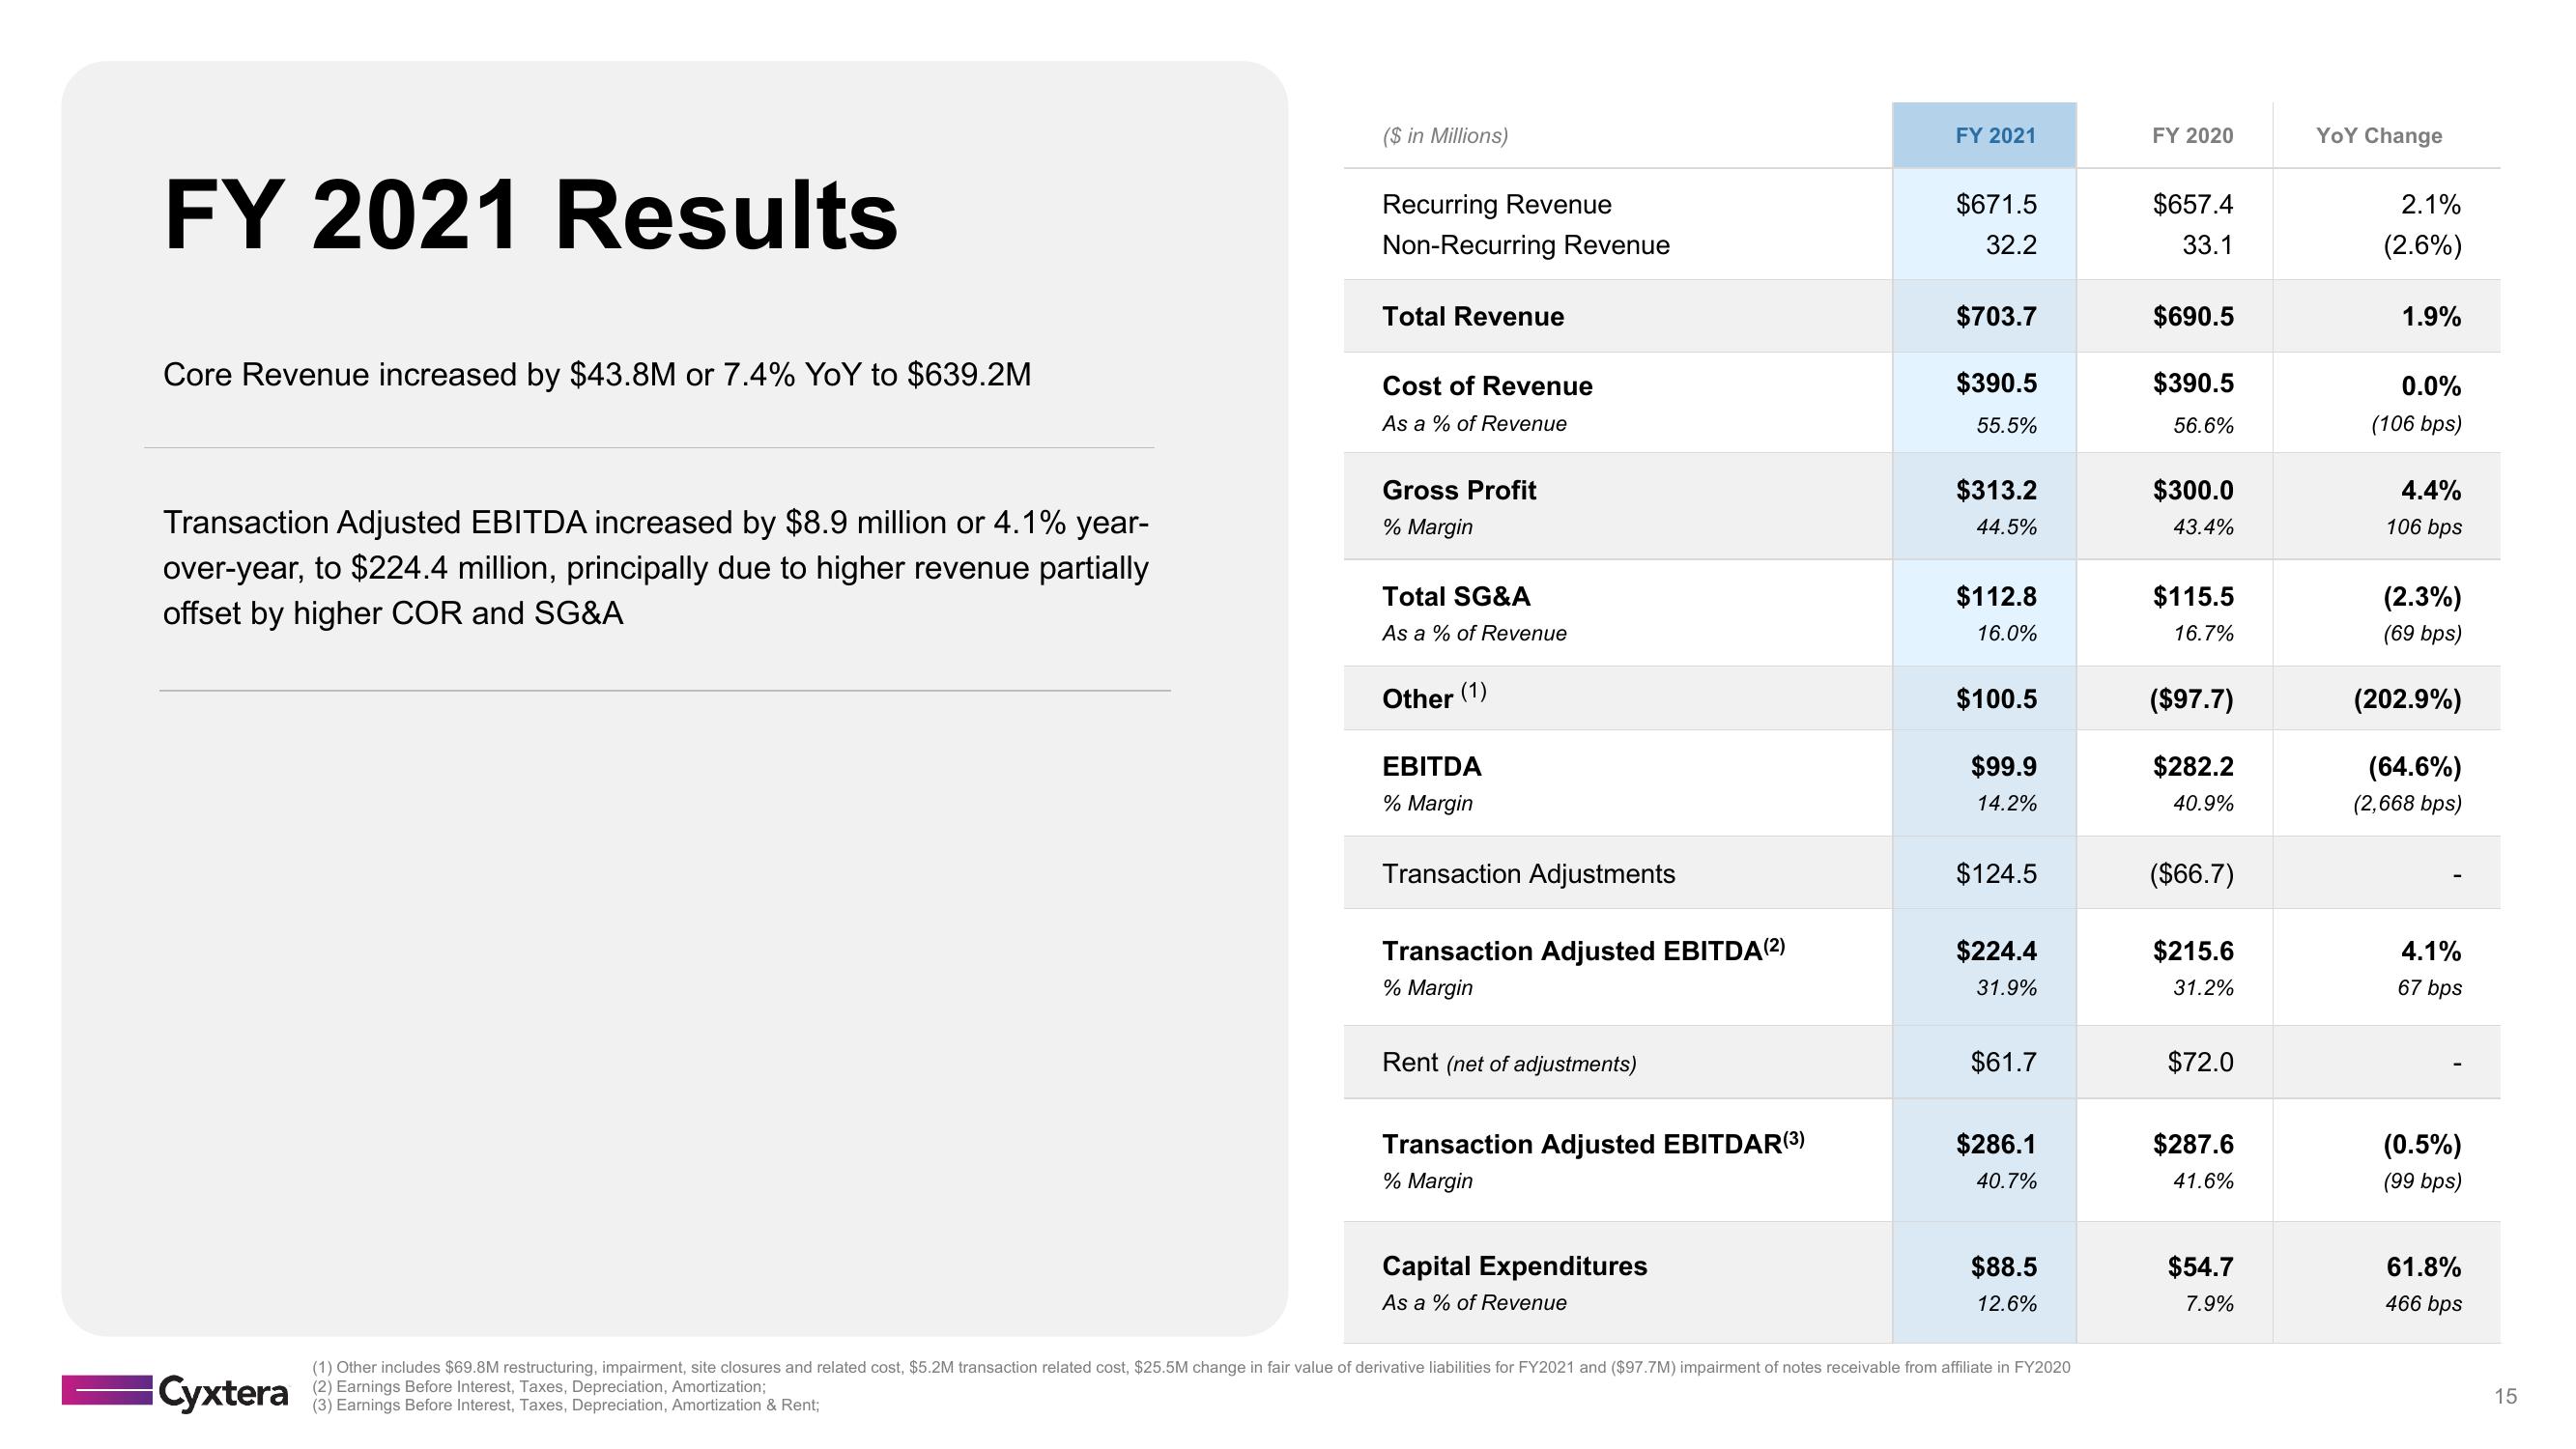
Core Revenue increased by $43.8M or 7.4% YoY to $639.2M
Transaction Adjusted EBITDA increased by $8.9 million or 4.1% year-
over-year, to $224.4 million, principally due to higher revenue partially
offset by higher COR and SG&A
($ in Millions)
Recurring Revenue
Non-Recurring Revenue
Total Revenue
Cost of Revenue
As a % of Revenue
Gross Profit
% Margin
Total SG&A
As a % of Revenue
Other (1)
EBITDA
% Margin
Transaction Adjustments
Transaction Adjusted EBITDA (2)
% Margin
Rent (net of adjustments)
Transaction Adjusted EBITDAR(3)
% Margin
Capital Expenditures
As a % of Revenue
FY 2021
$671.5
32.2
$703.7
$390.5
55.5%
$313.2
44.5%
$112.8
16.0%
$100.5
$99.9
14.2%
$124.5
$224.4
31.9%
$61.7
$286.1
40.7%
$88.5
12.6%
Cyxtera
(1) Other includes $69.8M restructuring, impairment, site closures and related cost, $5.2M transaction related cost, $25.5M change in fair value of derivative liabilities for FY2021 and ($97.7M) impairment of notes receivable from affiliate in FY2020
(2) Earnings Before Interest, Taxes, Depreciation, Amortization;
(3) Earnings Before Interest, Taxes, Depreciation, Amortization & Rent;
FY 2020
$657.4
33.1
$690.5
$390.5
56.6%
$300.0
43.4%
$115.5
16.7%
($97.7)
$282.2
40.9%
($66.7)
$215.6
31.2%
$72.0
$287.6
41.6%
$54.7
7.9%
YOY Change
2.1%
(2.6%)
1.9%
0.0%
(106 bps)
4.4%
106 bps
(2.3%)
(69 bps)
(202.9%)
(64.6%)
(2,668 bps)
4.1%
67 bps
(0.5%)
(99 bps)
61.8%
466 bps
15View entire presentation