Credit Suisse Results Presentation Deck
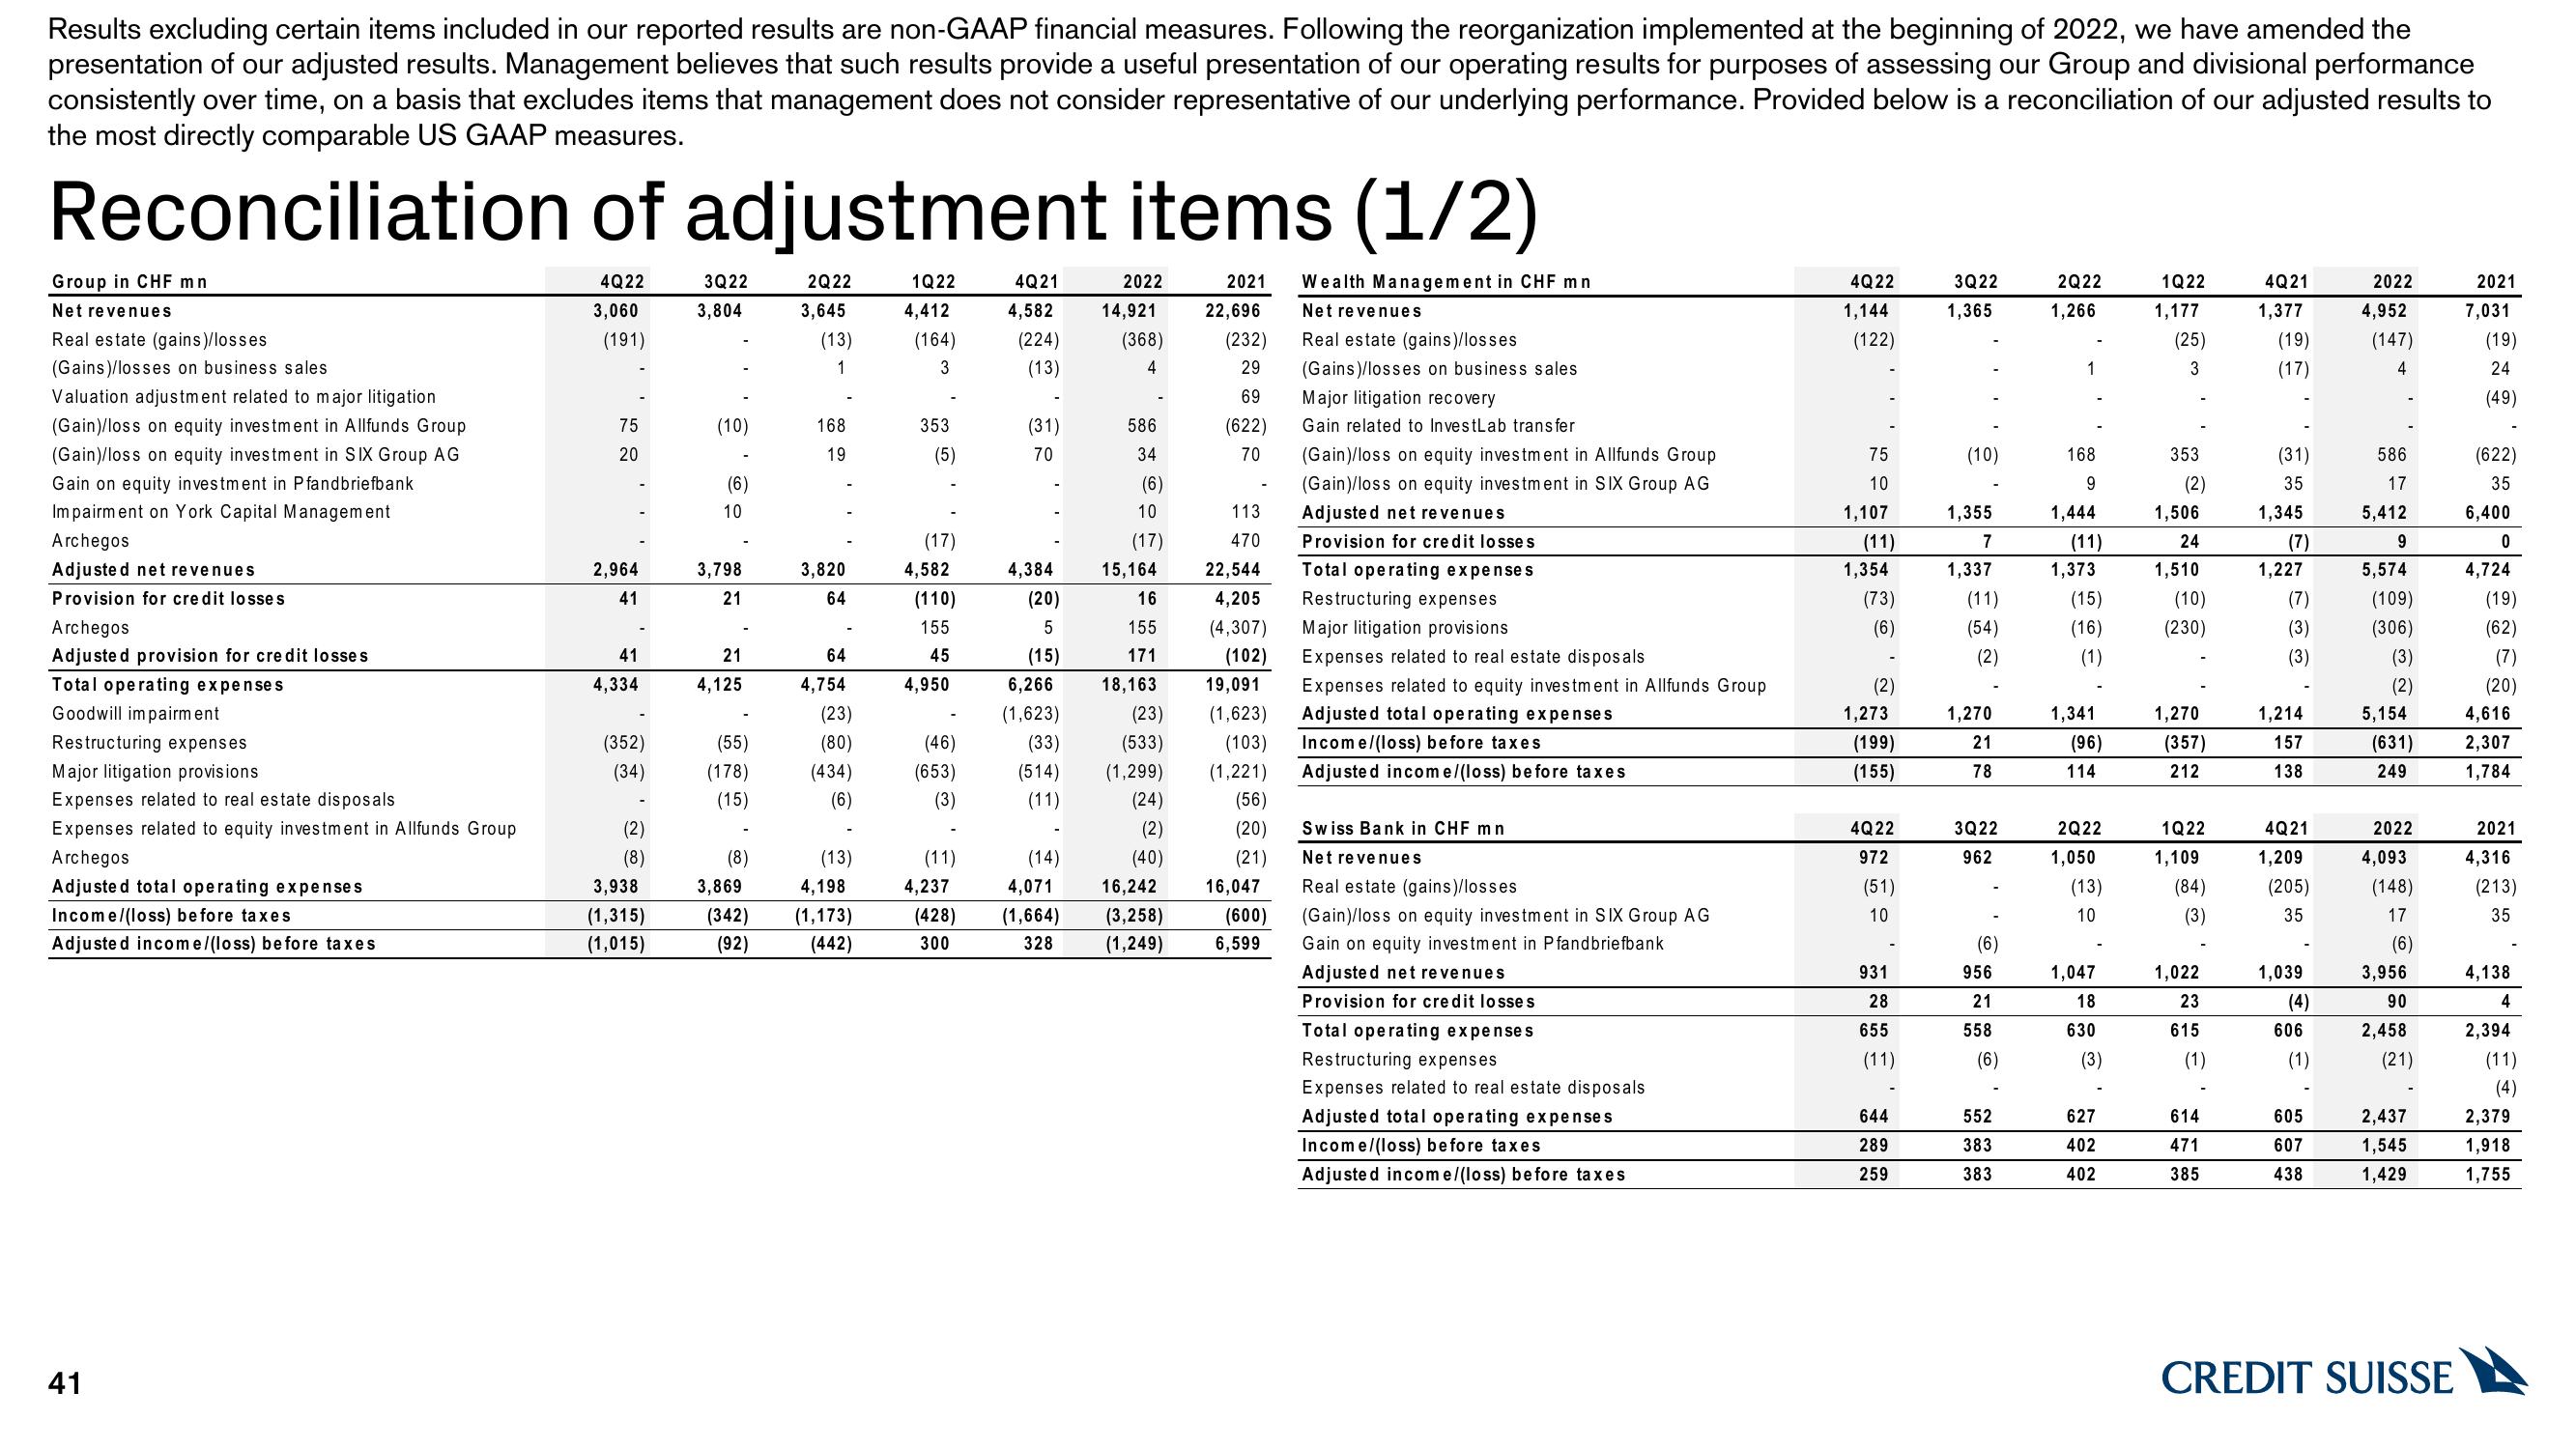
Results excluding certain items included in our reported results are non-GAAP financial measures. Following the reorganization implemented at the beginning of 2022, we have amended the
presentation of our adjusted results. Management believes that such results provide a useful presentation of our operating results for purposes of assessing our Group and divisional performance
consistently over time, on a basis that excludes items that management does not consider representative of our underlying performance. Provided below is a reconciliation of our adjusted results to
the most directly comparable US GAAP measures.
Reconciliation of adjustment items (1/2)
2021
4Q22
Wealth Management in CHF mn
Net revenues
Real estate (gains)/losses
(Gains)/losses on business sales
Group in CHF mn
Net revenues
Real estate (gains)/losses
(Gains)/losses on business sales
Valuation adjustment related to major litigation
(Gain)/loss on equity investment in Allfunds Group
(Gain)/loss on equity investment in SIX Group AG
Gain on equity investment in Pfandbriefbank
Impairment on York Capital Management
Archegos
Adjusted net revenues
Provision for credit losses
Archegos
Adjusted provision for credit losses
Total operating expenses
Goodwill impairment
Restructuring expenses
Major litigation provisions
Expenses related to real estate disposals
Expenses related to equity investment in Allfunds Group
Archegos
Adjusted total operating expenses
Income/(loss) before taxes
Adjusted income/(loss) before taxes
41
3,060
(191)
75
20
2,964
41
41
4,334
(352)
(34)
(2)
(8)
3,938
(1,315)
(1,015)
3Q22
3,804
(10)
(6)
10
3,798
21
21
4,125
(55)
(178)
(15)
(8)
2Q22
3,645
(13)
1
168
19
3,820
64
64
4,754
(23)
(80)
(434)
(6)
(13)
4,198
3,869
(342) (1,173)
(92)
(442)
1Q22
4,412
(164)
3
353
(5)
(17)
4,582
(110)
155
45
4,950
(46)
(653)
(3)
(11)
4Q21
4,582
(224)
(13)
(31)
70
(14)
2022
4,237
4,071
(428) (1,664)
300
328
14,921
(368)
4
586
34
(6)
10
4,384
(20)
5
(17)
15,164
16
155
(15)
171
6,266 18,163
(1,623)
(23) (1,623)
(33) (533) (103)
(514) (1,299) (1,221)
(11)
(24)
(56)
(2)
(20)
(40)
(21)
22,696
16,242
(3,258)
(1,249)
(232)
29
69
(622)
70
113
470
22,544
4,205
(4,307)
(102)
16,047
Restructuring expenses
Major litigation provisions
Expenses related to real estate disposals
19,091 Expenses related to equity investment in Allfunds Group
Adjusted total operating expenses
(600)
Major litigation recovery
Gain related to InvestLab transfer
6,599
(Gain)/loss on equity investment in Allfunds Group
(Gain)/loss on equity investment in SIX Group AG
Adjusted net revenues
Provision for credit losse s
Total operating expenses
Income/(loss) before taxes
Adjusted income/(loss) before taxes
Swiss Bank in CHF mn
Net revenues
Real estate (gains)/losses
(Gain)/loss on equity investment in SIX Group AG
Gain on equity investment in Pfandbriefbank
Adjusted net revenues
Provision for credit losse s
Total operating expenses
Restructuring expenses
Expenses related to real estate disposals
Adjusted total operating expenses
Income/(loss) before taxes
Adjusted income/(loss) before taxes
4Q22
1,144
(122)
75
10
1,107
(11)
1,354
(73)
(6)
(2)
1,273
(199)
(155)
4Q22
972
(51)
10
931
28
655
(11)
644
289
259
3Q22
1,365
(10)
1,355
7
1,337
(11)
(54)
(2)
1,270
21
78
3Q22
962
(6)
956
21
558
(6)
552
383
383
2Q22
1,266
168
9
1,444
(11)
1,373
(15)
(16)
(1)
1,341
(96)
114
2Q22
1,050
(13)
10
1,047
18
630
(3)
627
402
402
1Q22
1,177
(25)
3
353
(2)
1,506
24
1,510
(10)
(230)
1,270
(357)
212
1Q22
1,109
(84)
(3)
1,022
23
615
(1)
614
471
385
4Q21
1,377
(19)
(17)
(31)
35
1,345
(7)
1,227
(7)
(3)
(3)
1,214
157
138
4Q21
1,209
(205)
35
1,039
(4)
606
(1)
605
607
438
2022
4,952
(147)
4
586
17
5,412
9
5,574
(109)
(306)
(3)
(2)
5,154
(631)
249
2022
4,093
(148)
17
(6)
3,956
90
2,458
(21)
2,437
1,545
1,429
CREDIT SUISSE
2021
7,031
(19)
24
(49)
(622)
35
6,400
0
4,724
(19)
(62)
(7)
(20)
4,616
2,307
1,784
2021
4,316
(213)
35
4,138
4
2,394
(11)
(4)
2,379
1,918
1,755View entire presentation