J.P.Morgan Results Presentation Deck
JPMORGAN CHASE & CO.
CORPORATE & INVESTMENT BANK
FINANCIAL HIGHLIGHTS, CONTINUED
(in millions, except where otherwise noted)
BUSINESS METRICS
Advisory
Equity underwriting
Debt underwriting
Total investment banking fees
Client deposits and other third-party liabilities (average) (a)
Merchant processing volume (in billions) (b)
Assets under custody ("AUC") (period-end) (in billions)
95% Confidence Level - Total CIB VaR (average)
CIB trading VaR by risk type: (c)
Fixed income
Foreign exchange
Equities
Commodities and other
Diversification benefit to CIB trading VaR (d)
CIB trading VaR (c)
Credit Portfolio VaR (e)
Diversification benefit to CIB VaR (d)
CIB VaR
$
$
$
3Q22
$
848
290
624
1,762
669,215
$ 27,157
545.4
64
9
11
14
(47)
51
10
(8)
53
$
$
$
2Q22
$
664
245
741
1,650
722,388
$ 28,579
539.6
60
8
11
14
(43)
50
17
(15)
52
$
$
$
1Q22
$
QUARTERLY TRENDS
801
249
1,000
2,050
709,121
$ 31,571
490.2
47
4
12
15
(33)
45
29
(10)
64
$
$
4Q21
$
1,557
802
1,143
3,502
717,496
$ 33,221
514.9
39
4
12
12
(31)
36
5
(4)
37
$
$
$
3Q21
1,228
1,032
1,037
3,297
714,376
470.9
31,962
38
5
11
11
(33)
32
5
(4)
33
3Q22 Change
2Q22
28 %
18
(16)
7
(7)
1
(5)
7
13
(9)
2
(41)
47
2
JPMORGAN CHASE & CO.
3Q21
(31)%
(72)
(40)
(47)
(6)
16
(15)
68
80
27
(42)
59
100
(100)
61
$
$
$
NINE MONTHS ENDED SEPTEMBER 30,
2022
2,313
784
2,365
5,462
700,095
1,575.2
27,157
$
$
$
2021
2,824
3,151
3,882
9,857
714,039
1,371.8
31,962
2022 Change
2021
(18)%
(75)
(39)
(45)
(2)
15
(15)
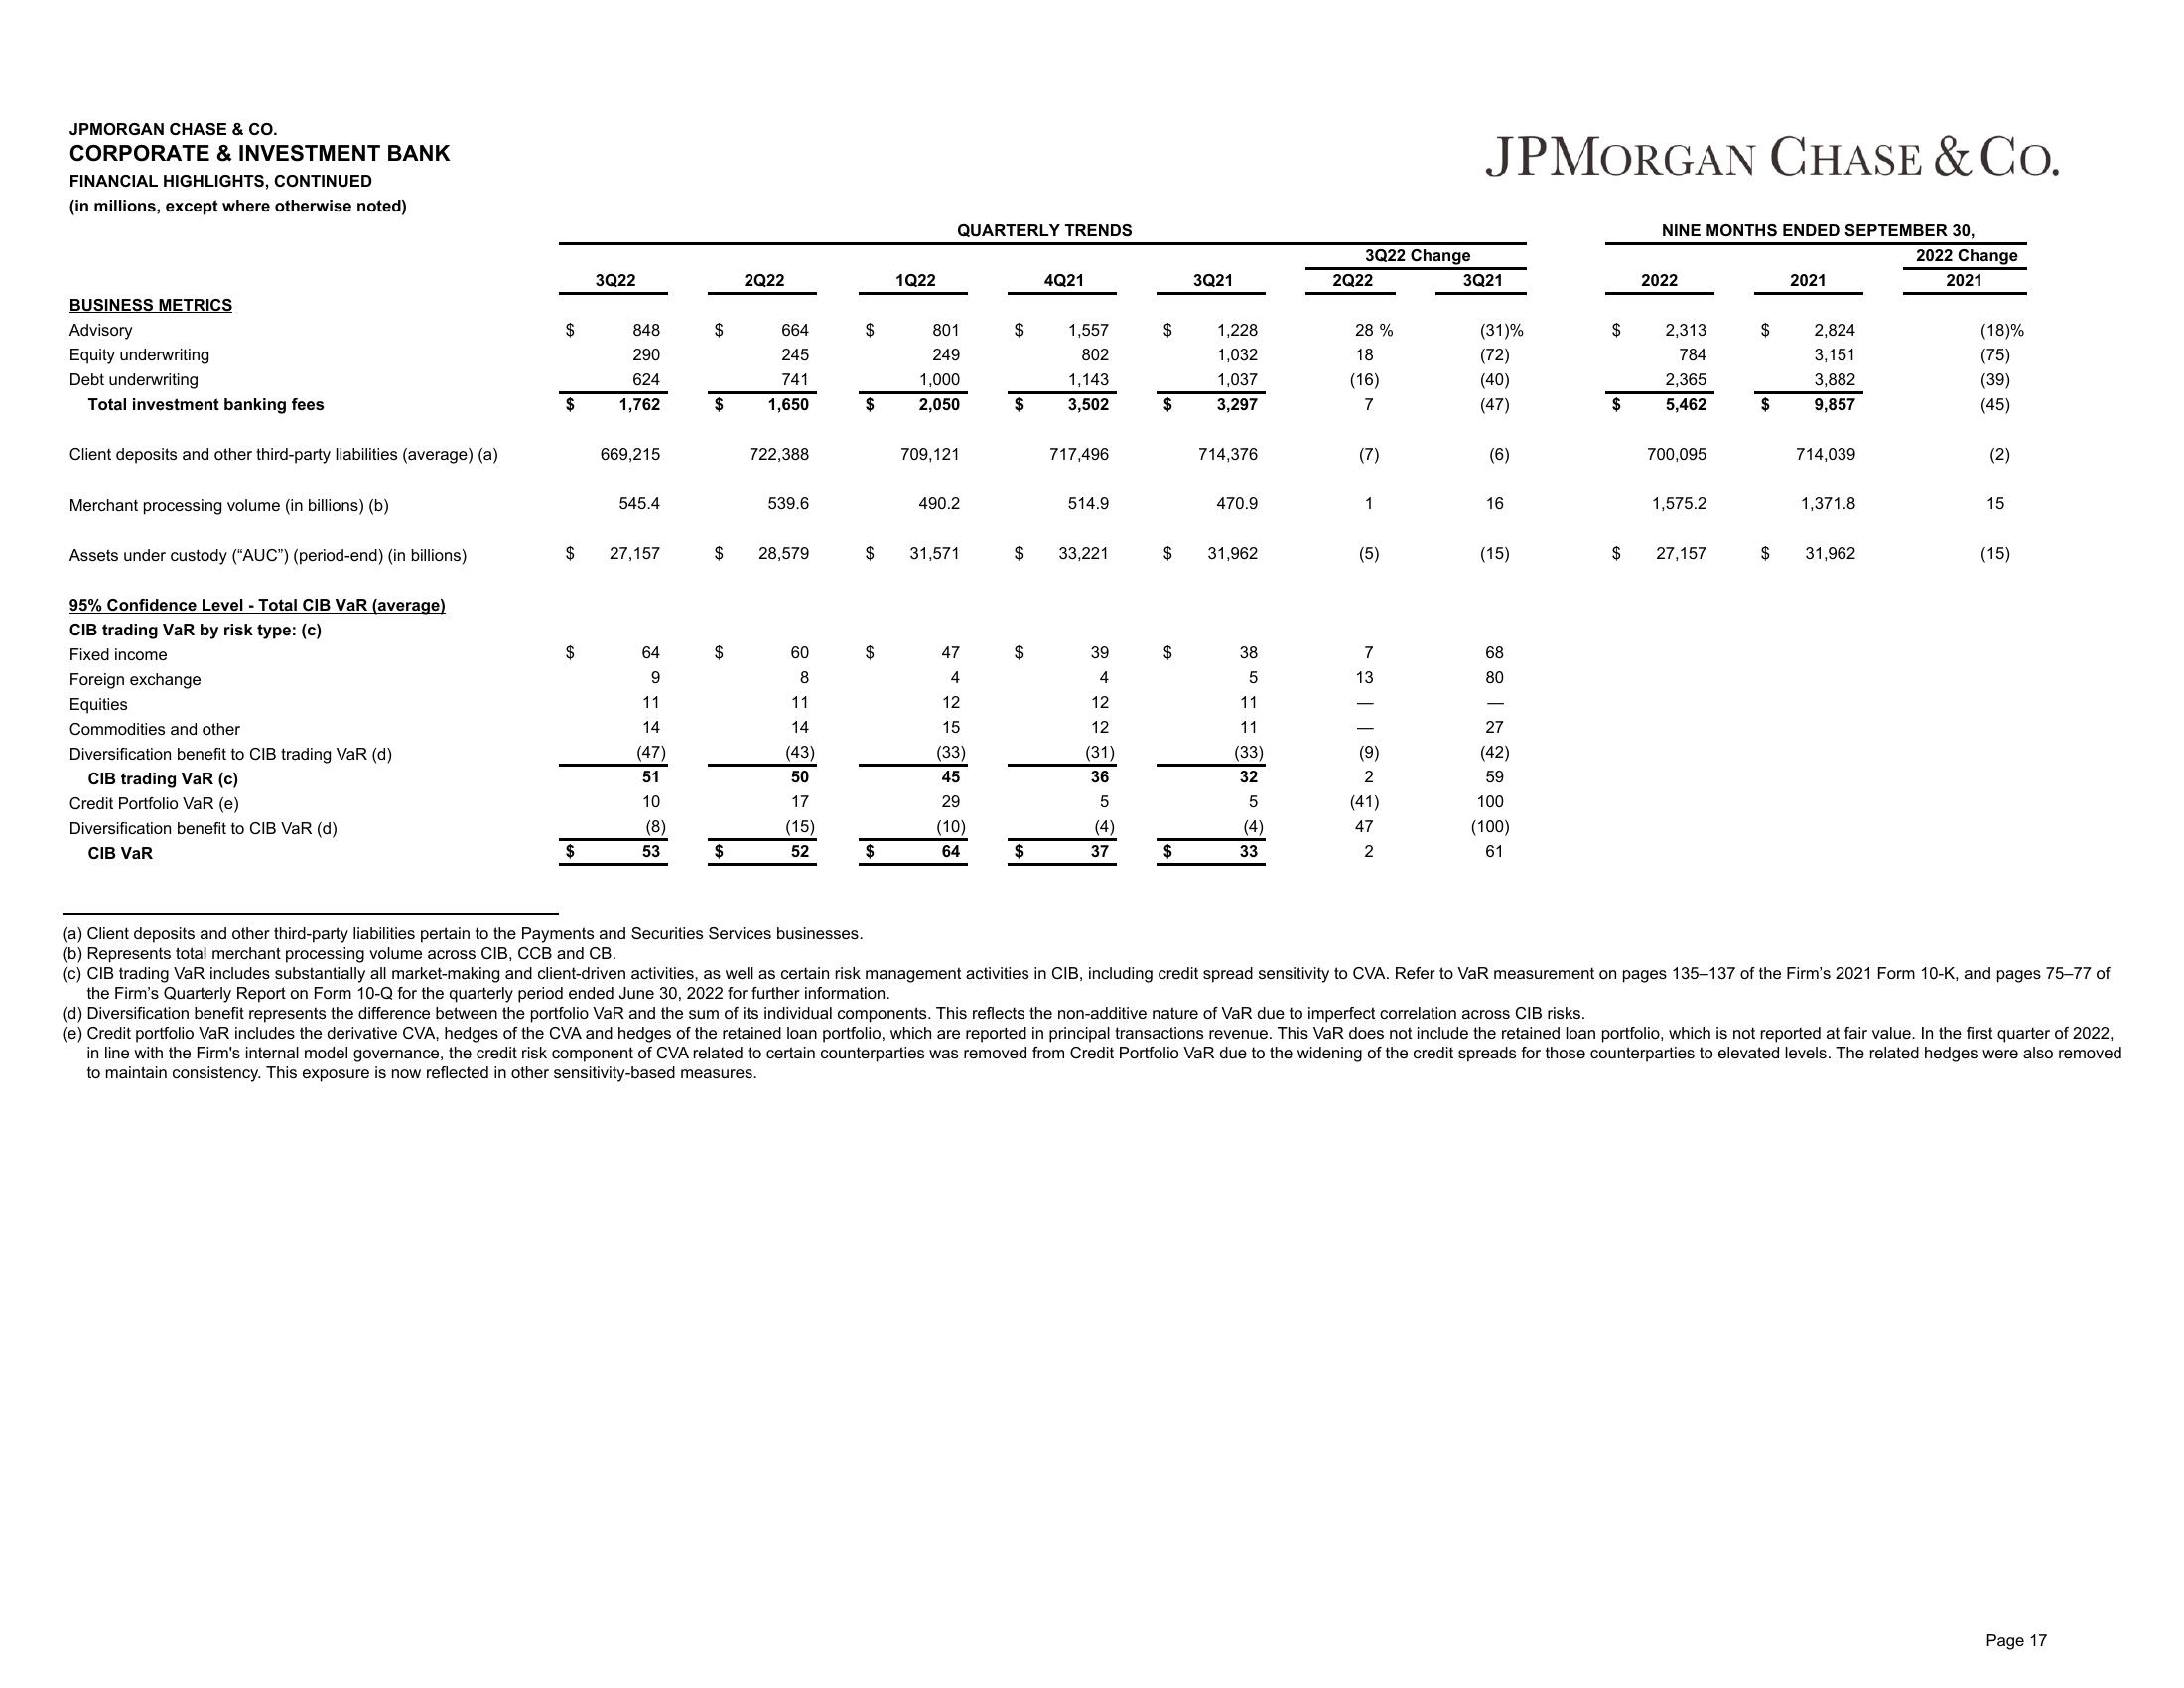
(a) Client deposits and other third-party liabilities pertain to the Payments and Securities Services businesses.
(b) Represents total merchant processing volume across CIB, CCB and CB.
(c) CIB trading VaR includes substantially all market-making and client-driven activities, as well as certain risk management activities in CIB, including credit spread sensitivity to CVA. Refer to VaR measurement on pages 135-137 of the Firm's 2021 Form 10-K, and pages 75-77 of
the Firm's Quarterly Report on Form 10-Q for the quarterly period ended June 30, 2022 for further information.
(d) Diversification benefit represents the difference between the portfolio VaR and the sum of its individual components. This reflects the non-additive nature of VaR due to imperfect correlation across CIB risks.
(e) Credit portfolio VaR includes the derivative CVA, hedges of the CVA and hedges of the retained loan portfolio, which are reported in principal transactions revenue. This VaR does not include the retained loan portfolio, which is not reported at fair value. In the first quarter of 2022,
in line with the Firm's internal model governance, the credit risk component of CVA related to certain counterparties was removed from Credit Portfolio VaR due to the widening of the credit spreads for those counterparties to elevated levels. The related hedges were also removed
to maintain consistency. This exposure is now reflected in other sensitivity-based measures.
Page 17View entire presentation