AMD Results Presentation Deck slide image

AMD Results Presentation Deck

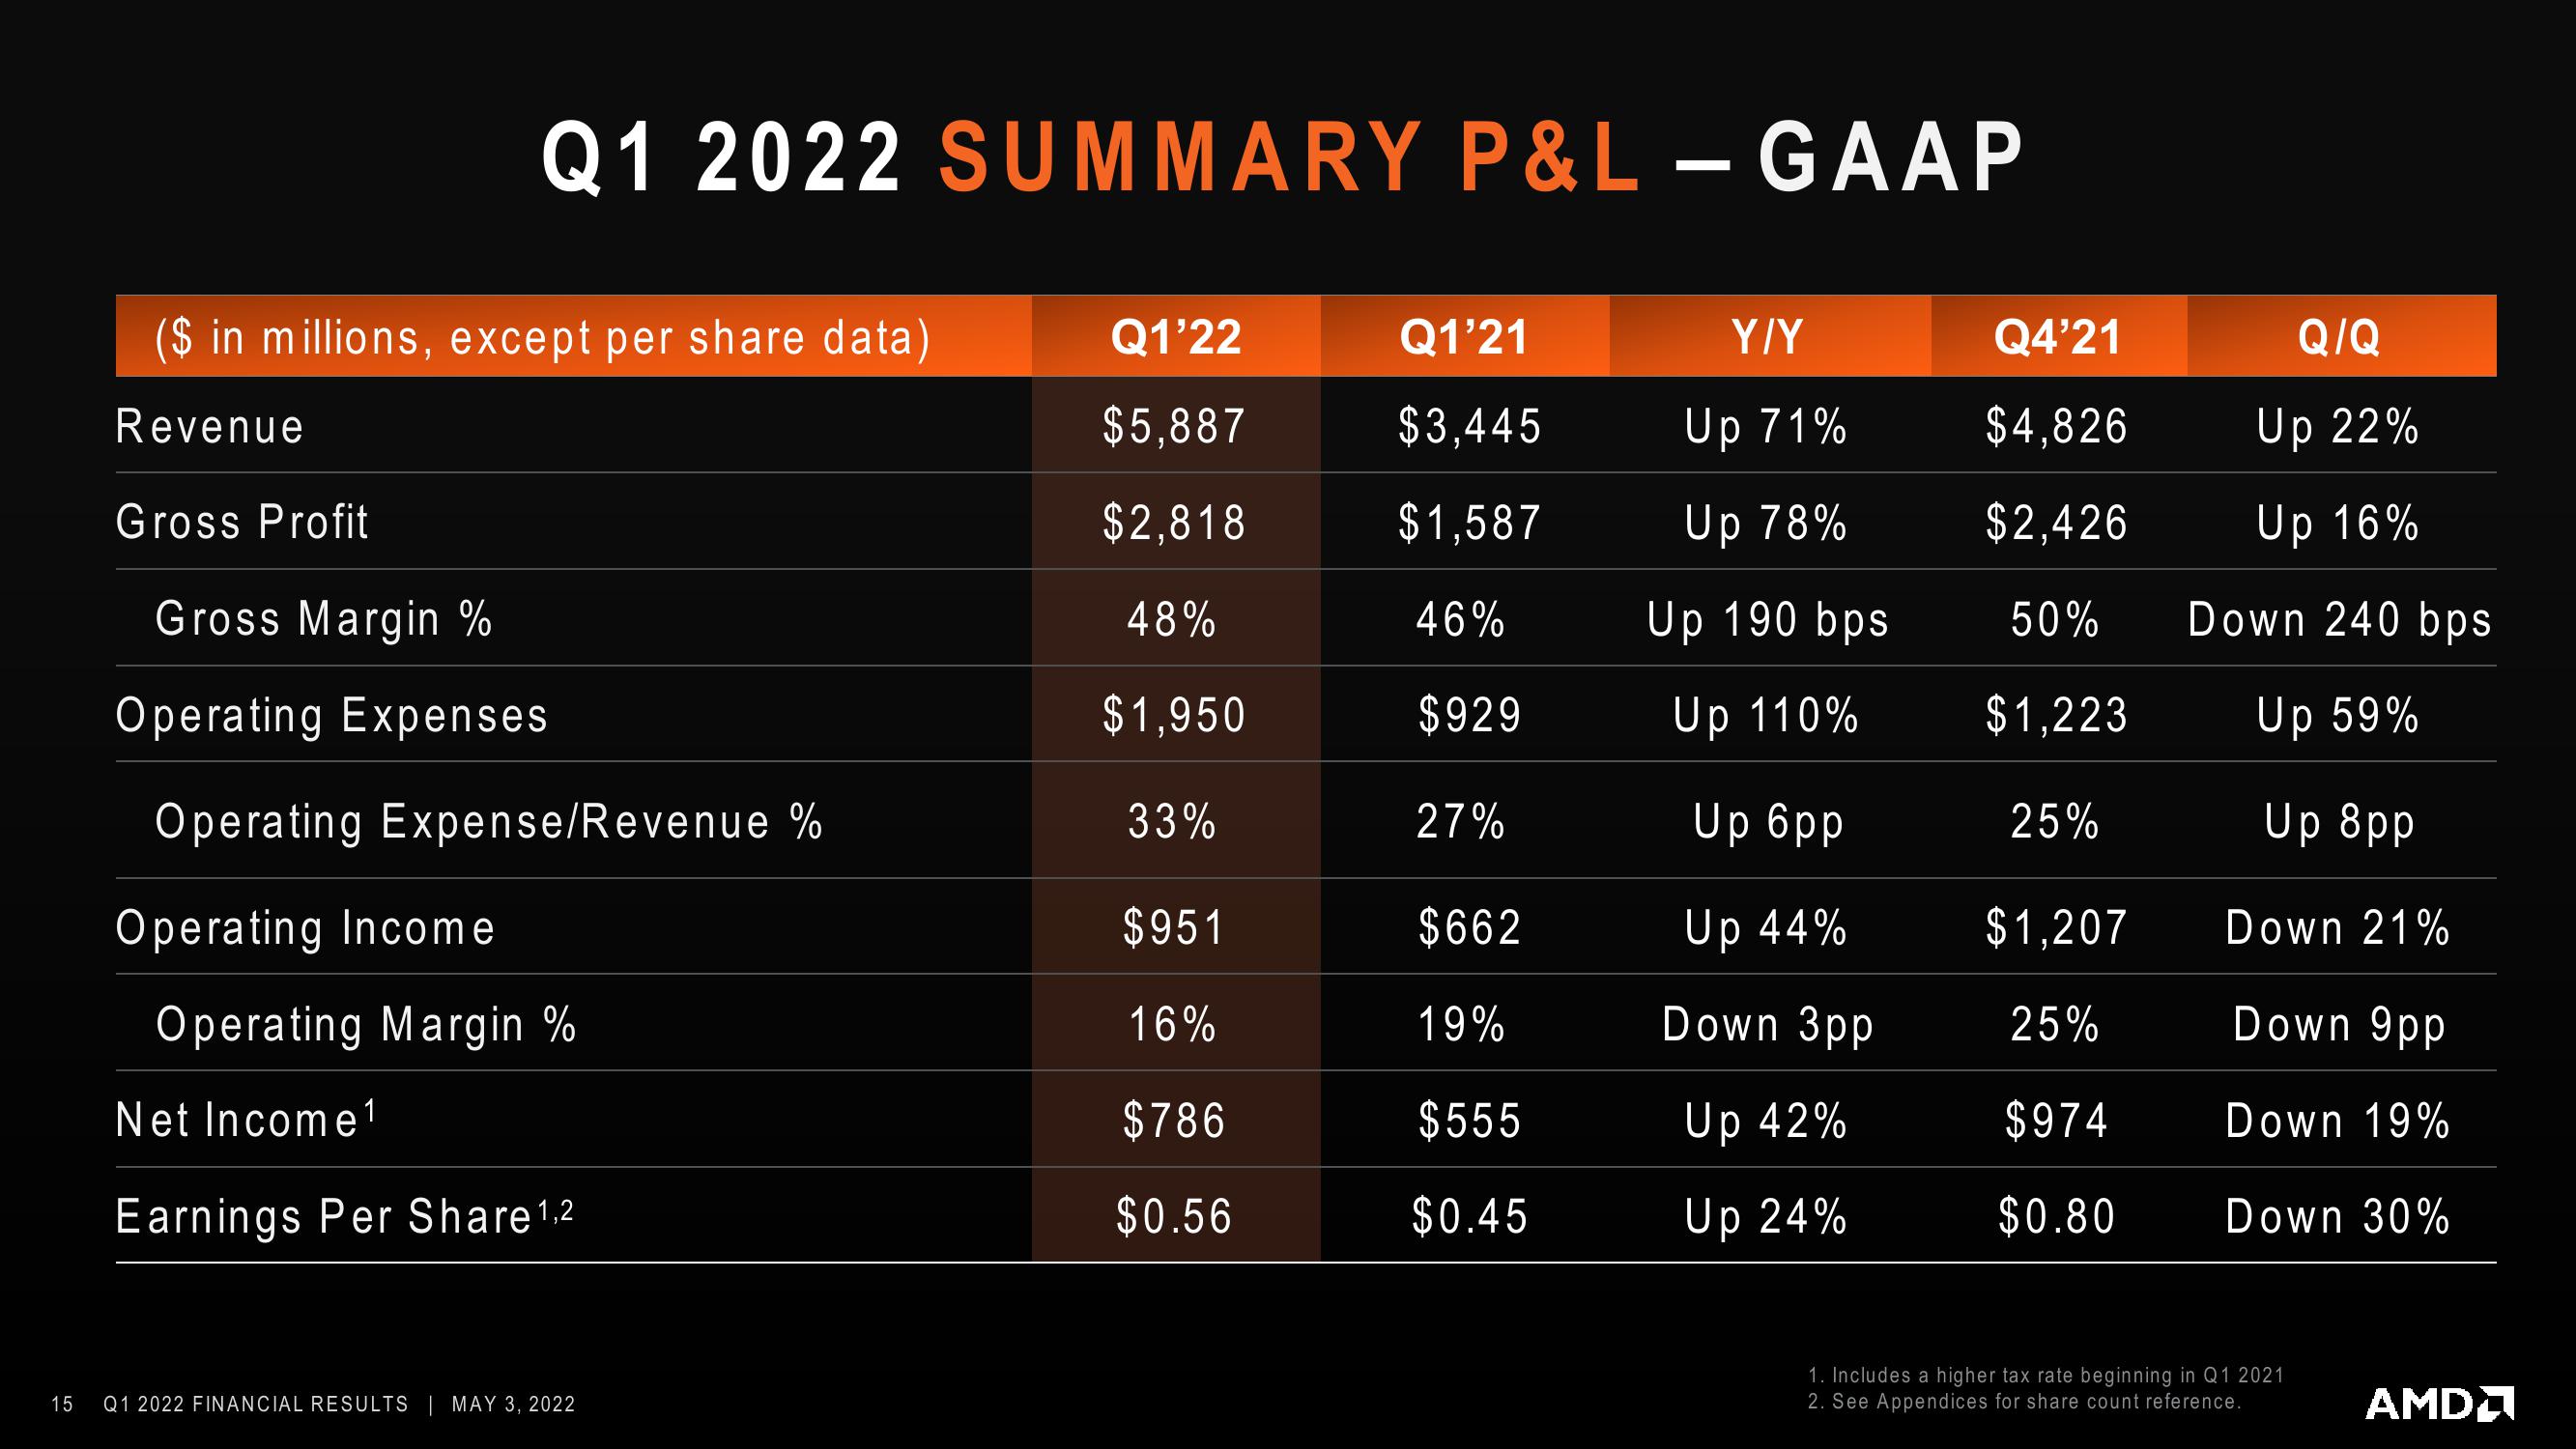
15 Q1 2022 SUMMARY P&L - GAAP ($ in millions, except per share data) Revenue Gross Profit Gross Margin % Operating Expenses Operating Expense/Revenue % Operating Income Operating Margin % Net Income ¹ Earnings Per Share ¹,2 Q1 2022 FINANCIAL RESULTS | MAY 3, 2022 Q1'22 $5,887 $2,818 48% $1,950 33% $951 16% $786 $0.56 Q1'21 $3,445 $1,587 46% $929 27% $662 19% $555 $0.45 Y/Y Up 71% Up 78% Up 190 bps Up 110% Up 6pp Up 44% Down 3pp Up 42% Up 24% Q4'21 $4,826 $2,426 50% $1,223 25% $1,207 25% $974 $0.80 Q/Q Up 22% Up 16% Down 240 bps Up 59% Up 8pp Down 21% Down 9pp Down 19% Down 30% 1. Includes a higher tax rate beginning in Q1 2021 2. See Appendices for share count reference. AMD
View entire presentation