TPG Results Presentation Deck
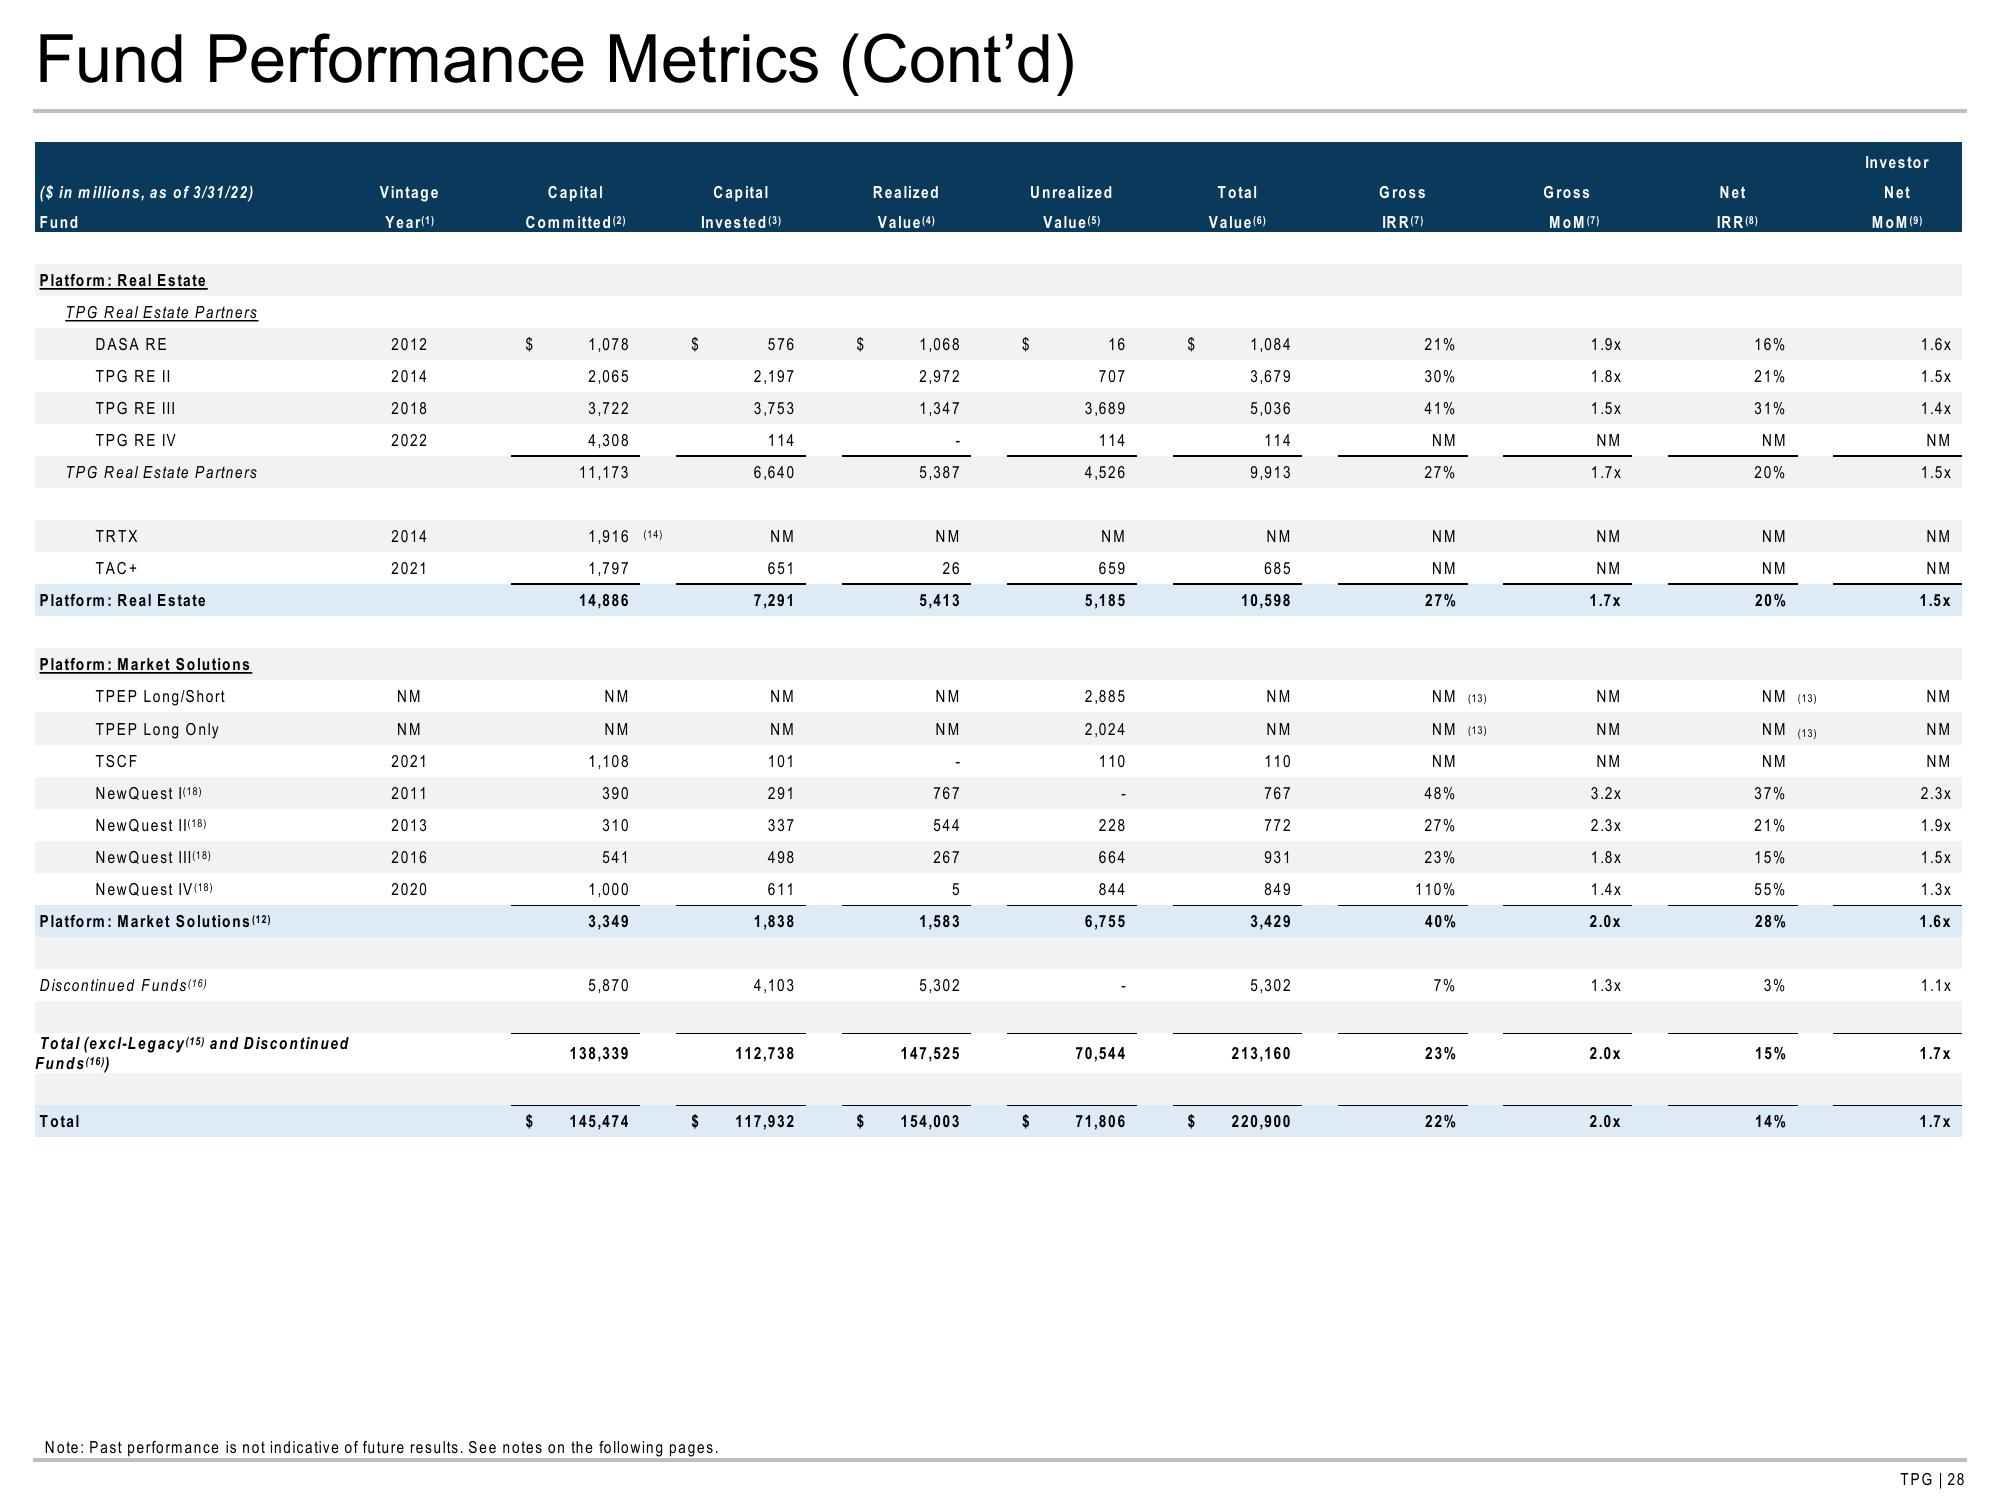
Fund Performance Metrics (Cont'd)
($ in millions, as of 3/31/22)
Fund
Platform: Real Estate
TPG Real Estate Partners
DASA RE
TPG RE II
TPG RE III
TPG RE IV
TPG Real Estate Partners
TRTX
TAC+
Platform: Real Estate
Platform: Market Solutions
TPEP Long/Short
TPEP Long Only
TSCF
NewQuest (18)
NewQuest II(18)
New Quest III(18)
NewQuest IV (18)
Platform: Market Solutions (12)
Discontinued Funds(16)
Total
Total (excl-Legacy (15) and Discontinued
Funds (16))
Vintage
Year(1)
2012
2014
2018
2022
2014
2021
NM
NM
2021
2011
2013
2016
2020
Capital
Committed (2)
$
1,078
2,065
3,722
4,308
11,173
1,916 (14)
1,797
14,886
NM
NM
1,108
390
310
541
1,000
3,349
5,870
138,339
$ 145,474
$
Capital
Invested (3)
576
2,197
3,753
114
6,640
Note: Past performance is not indicative of future results. See notes on the following pages.
NM
651
7,291
NM
NM
101
291
337
498
611
1,838
4,103
112,738
$ 117,932
$
Realized
Value (4)
1,068
2,972
1,347
5,387
NM
26
5,413
NM
NM
767
544
267
5
1,583
5,302
147,525
154,003
Unrealized
Value (5)
$
$
16
707
3,689
114
4,526
NM
659
5,185
2,885
2,024
110
228
664
844
6,755
70,544
71,806
$
Total
Value (6)
1,084
3,679
5,036
114
9,913
NM
685
10,598
NM
NM
110
767
772
931
849
3,429
5,302
213,160
$ 220,900
Gross
IRR (7)
21%
30%
41%
NM
27%
NM
NM
27%
NM (13)
NM (13)
NM
48%
27%
23%
110%
40%
7%
23%
22%
Gross
MOM (7)
1.9x
1.8x
1.5x
NM
1.7x
NM
NM
1.7x
NM
NM
NM
3.2x
2.3x
1.8x
1.4x
2.0x
1.3x
2.0x
2.0x
Net
IRR (8)
16%
21%
31%
NM
20%
NM
NM
20%
NM (13)
NM (13)
NM
37%
21%
15%
55%
28%
3%
15%
14%
Investor
Net
MOM (⁹)
1.6x
1.5x
1.4x
NM
1.5x
NM
NM
1.5x
NM
NM
NM
2.3x
1.9x
1.5x
1.3x
1.6x
1.1x
1.7x
1.7x
TPG | 28View entire presentation