Inovalon Investor Conference Presentation Deck
Strong Growth
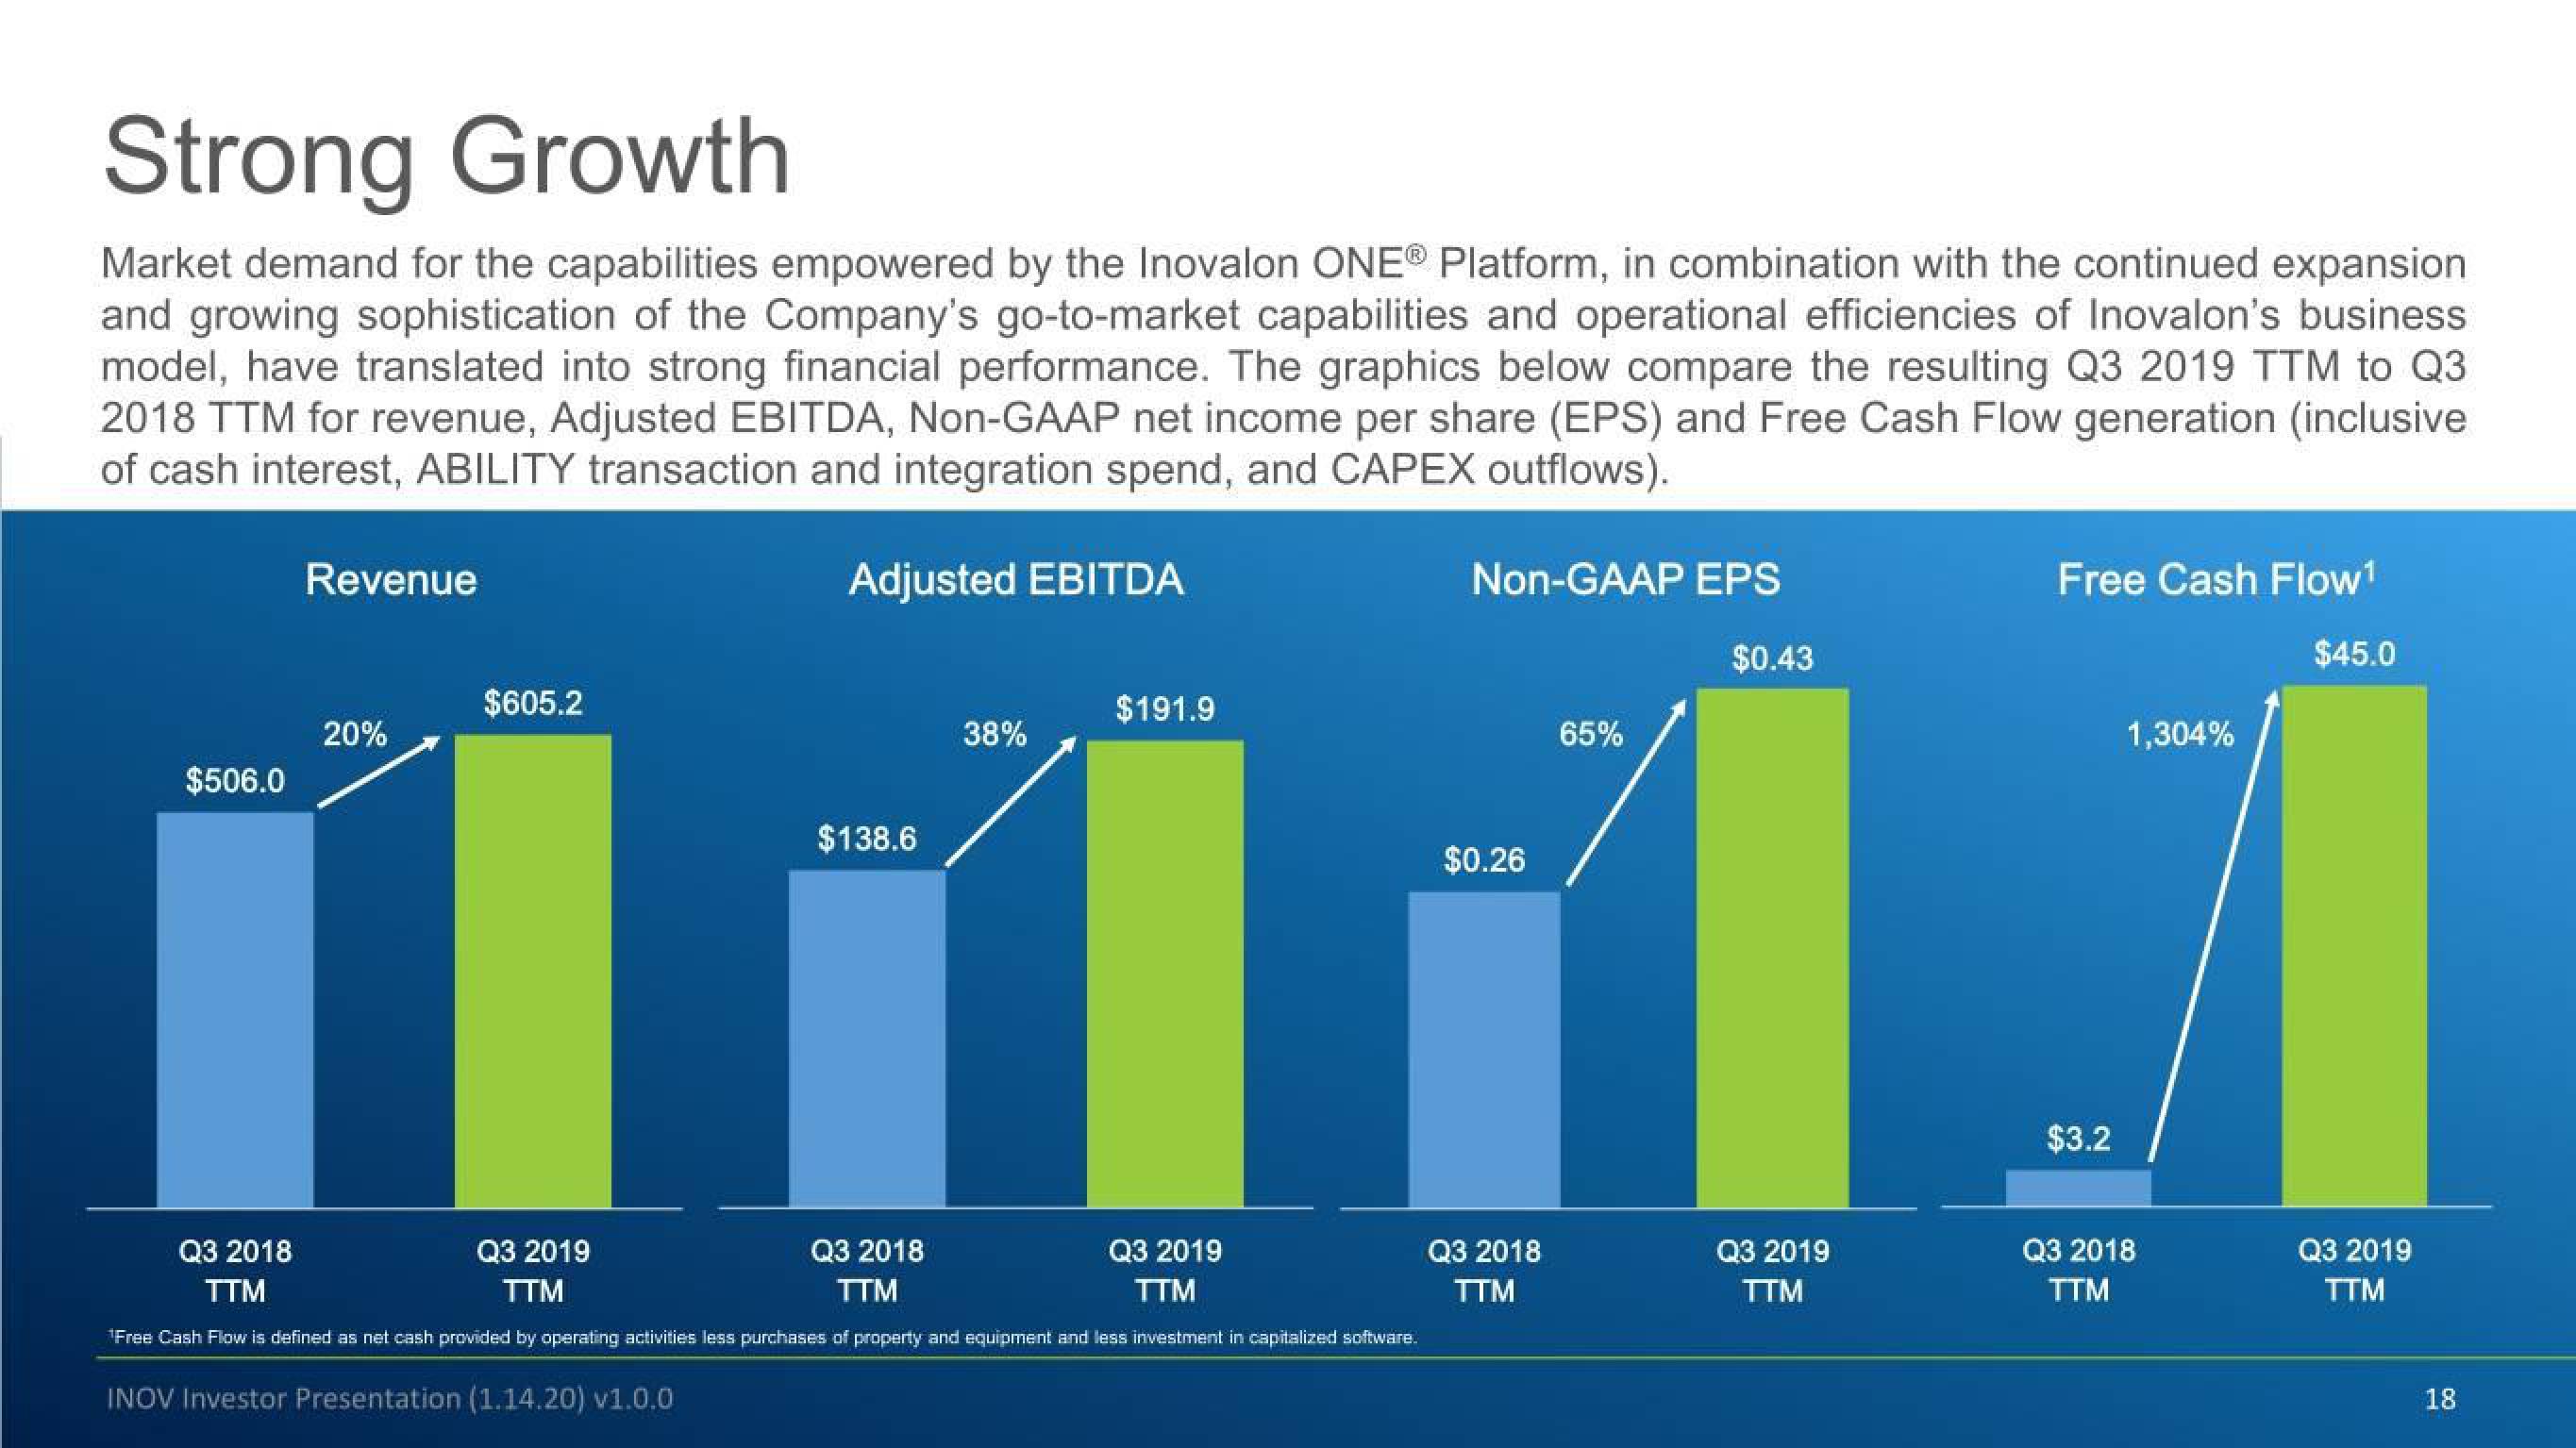
Market demand for the capabilities empowered by the Inovalon ONE® Platform, in combination with the continued expansion
and growing sophistication of the Company's go-to-market capabilities and operational efficiencies of Inovalon's business
model, have translated into strong financial performance. The graphics below compare the resulting Q3 2019 TTM to Q3
2018 TTM for revenue, Adjusted EBITDA, Non-GAAP net income per share (EPS) and Free Cash Flow generation (inclusive
of cash interest, ABILITY transaction and integration spend, and CAPEX outflows).
$506.0
Revenue
20%
$605.2
Adjusted EBITDA
INOV Investor Presentation (1.14.20) v1.0.0
$138.6
38%
Q3 2018
TTM
Q3 2018
Q3 2019
TTM
Q3 2019
TTM
TTM
*Free Cash Flow is defined as net cash provided by operating activities less purchases of property and equipment and less investment in capitalized software.
$191.9
Non-GAAP EPS
$0.26
Q3 2018
TTM
65%
$0.43
Q3 2019
TTM
Free Cash Flow¹
$45.0
$3.2
1,304%
Q3 2018
TTM
Q3 2019
TTM
18View entire presentation