Disney Results Presentation Deck
Total Hulu (¹)
LiveTV + SVOD
SVOD Only
SVOD Only ARPU
Live TV+SVOD ARPU
Q2 Hulu and ESPN+ Subscribers & ARPU
(Paid Subscribers in Millions and Average Monthly Revenue per Paid Subscriber (ARPU) in USD)
ARPU
hulu Subscribers
45.6
4.1
41.4
22.3
48.0
4.5
43.5
Q2'22
Q1'23
Q2'23
$12.46 $11.73
$12.77
$88.77 $87.90 $92.32
Q2'22
ESP+ Subscribers
Q1'23
$5.53
Note: See DTC Product Descriptions and Key Definitions on page 17
(1) Total may not equal the sum due to rounding
ⒸDisney
$4.73
48.2
4.4
24.9
43.7
25.3
Q2'23
$5.64
Q2'23 vs.
Q2'22 Q1'23
+2.6
+0.2
+0.3
(0.1)
+2.3
+0.2
($1.04) ($0.73)
+$3.55 +$4.42
+3.0
+0.4
+$0.91 +$0.11
Hulu
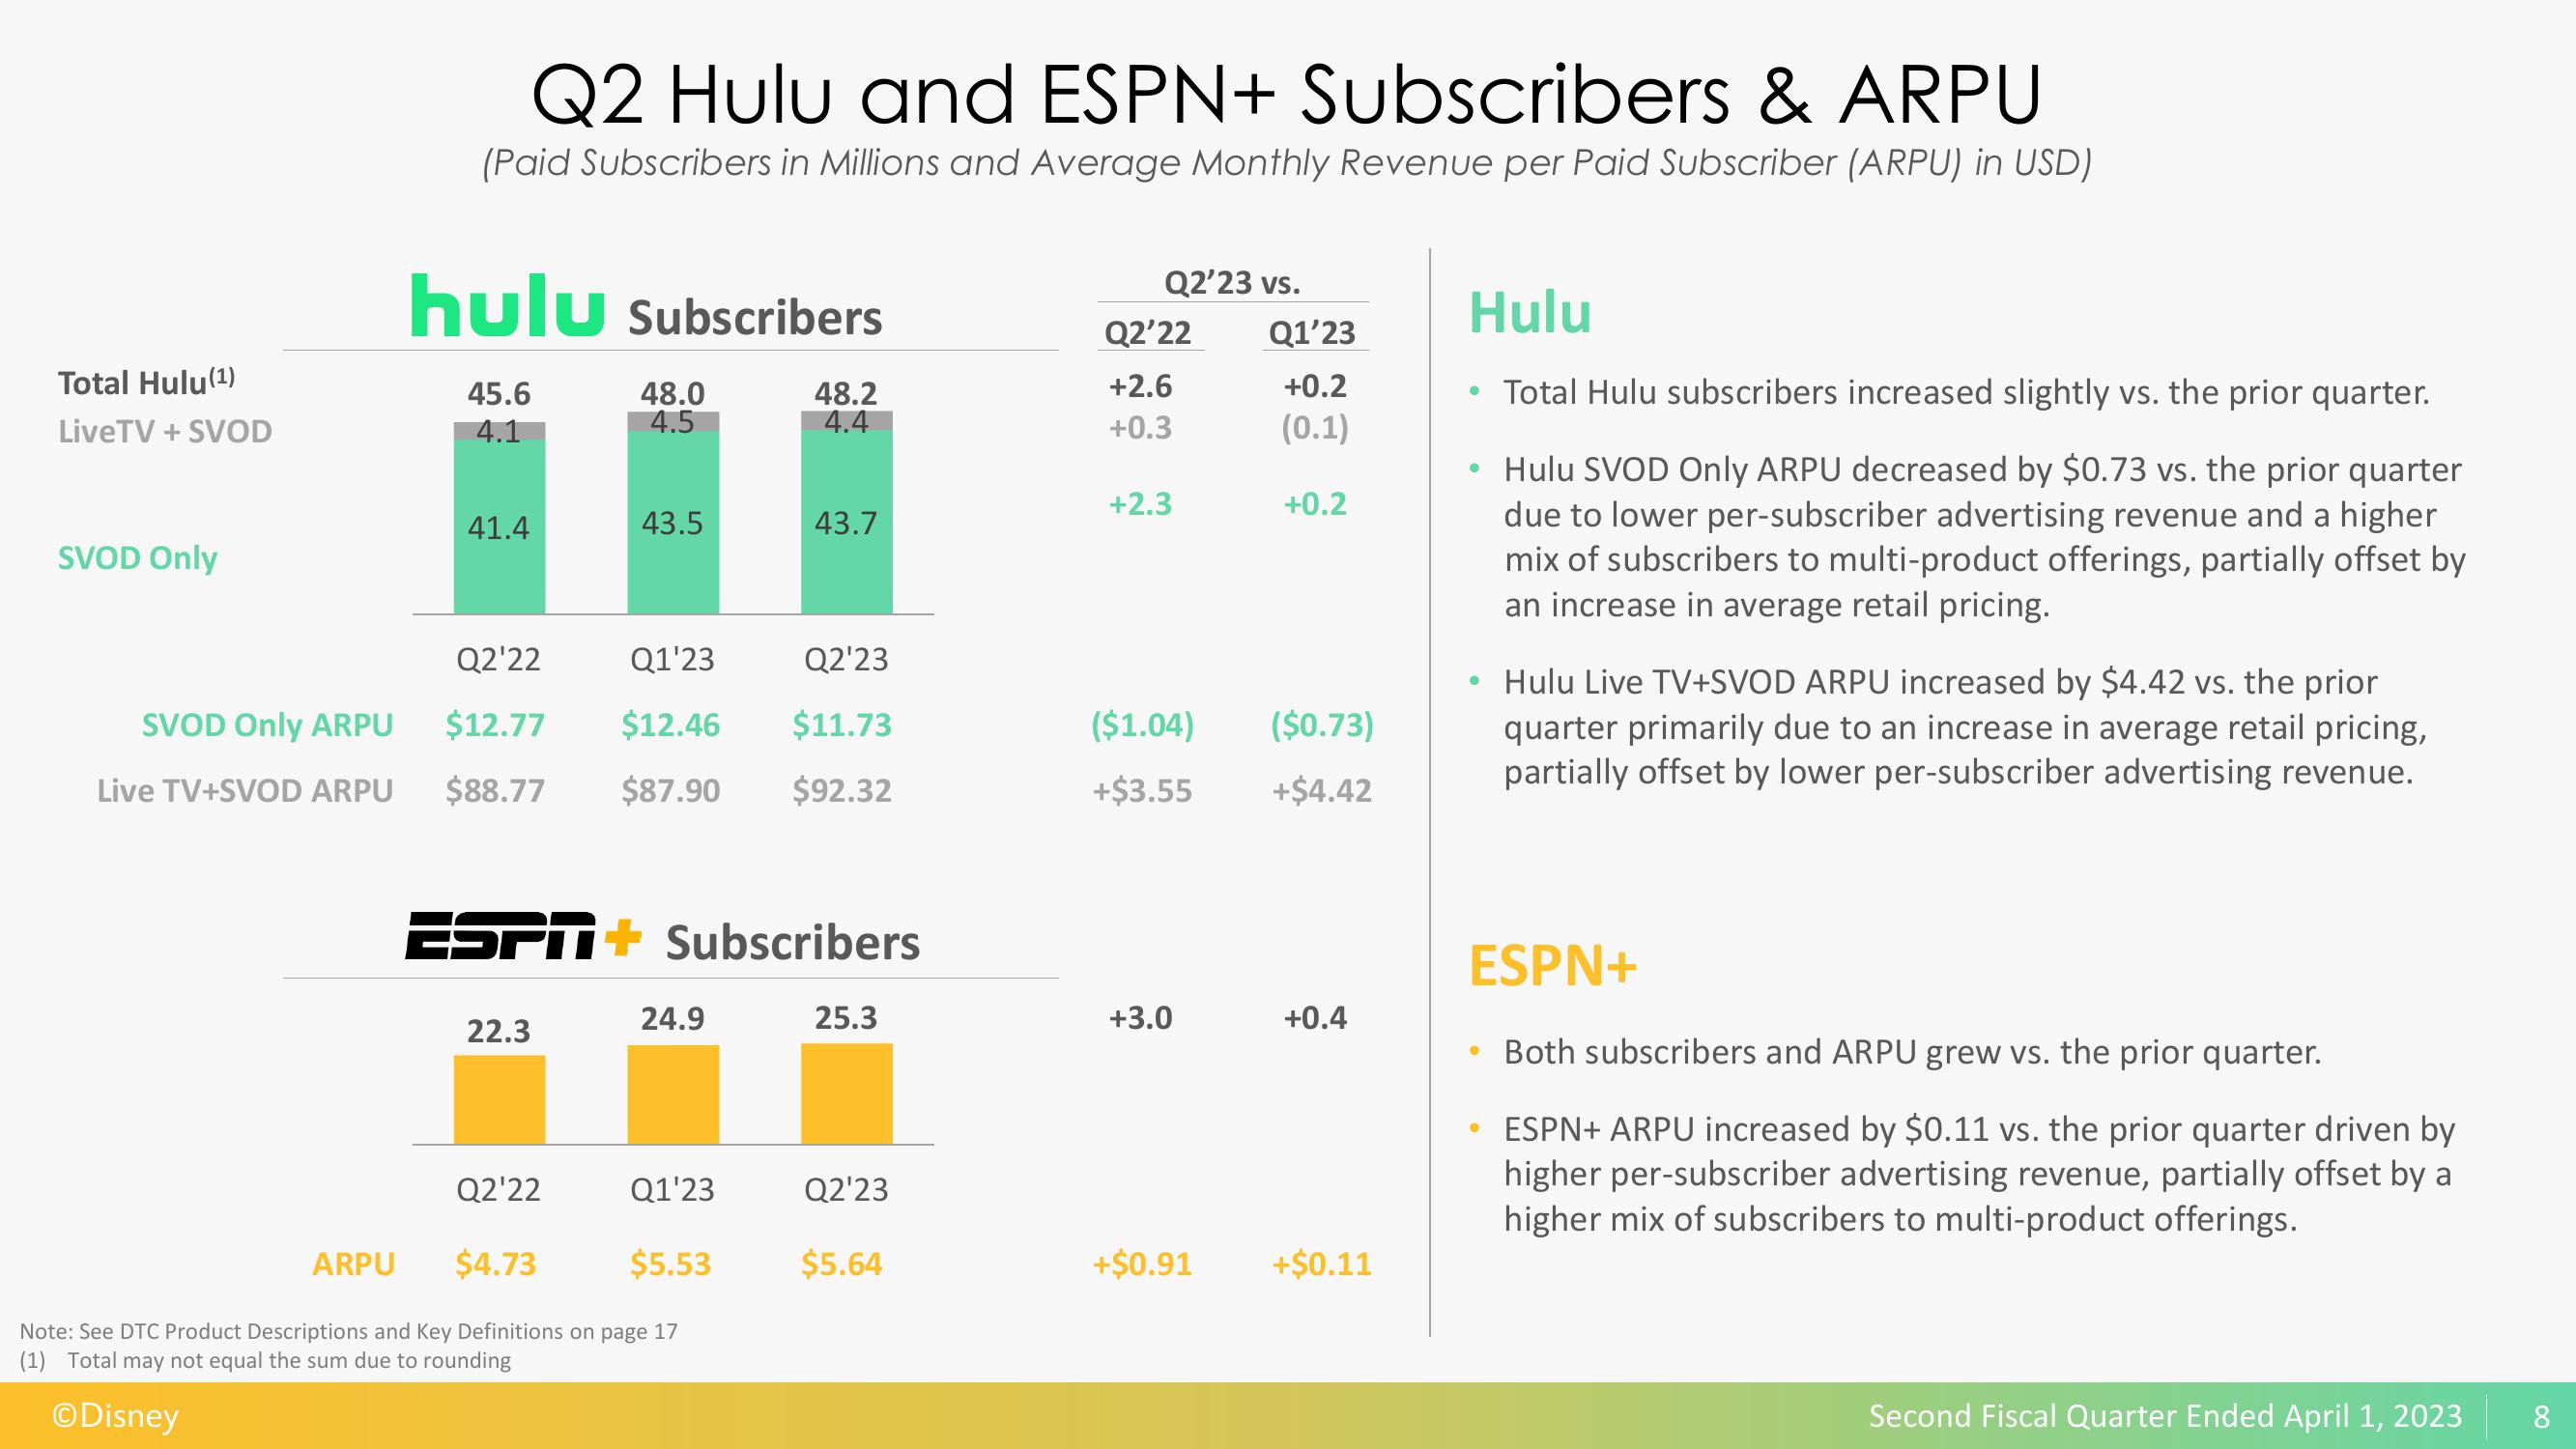
Total Hulu subscribers increased slightly vs. the prior quarter.
Hulu SVOD Only ARPU decreased by $0.73 vs. the prior quarter
due to lower per-subscriber advertising revenue and a higher
mix of subscribers to multi-product offerings, partially offset by
an increase in average retail pricing.
Hulu Live TV+SVOD ARPU increased by $4.42 vs. the prior
quarter primarily due to an increase in average retail pricing,
partially offset by lower per-subscriber advertising revenue.
ESPN+
Both subscribers and ARPU grew vs. the prior quarter.
ESPN+ ARPU increased by $0.11 vs. the prior quarter driven by
higher per-subscriber advertising revenue, partially offset by a
higher mix of subscribers to multi-product offerings.
Second Fiscal Quarter Ended April 1, 2023
8View entire presentation