Near Investor Presentation Deck
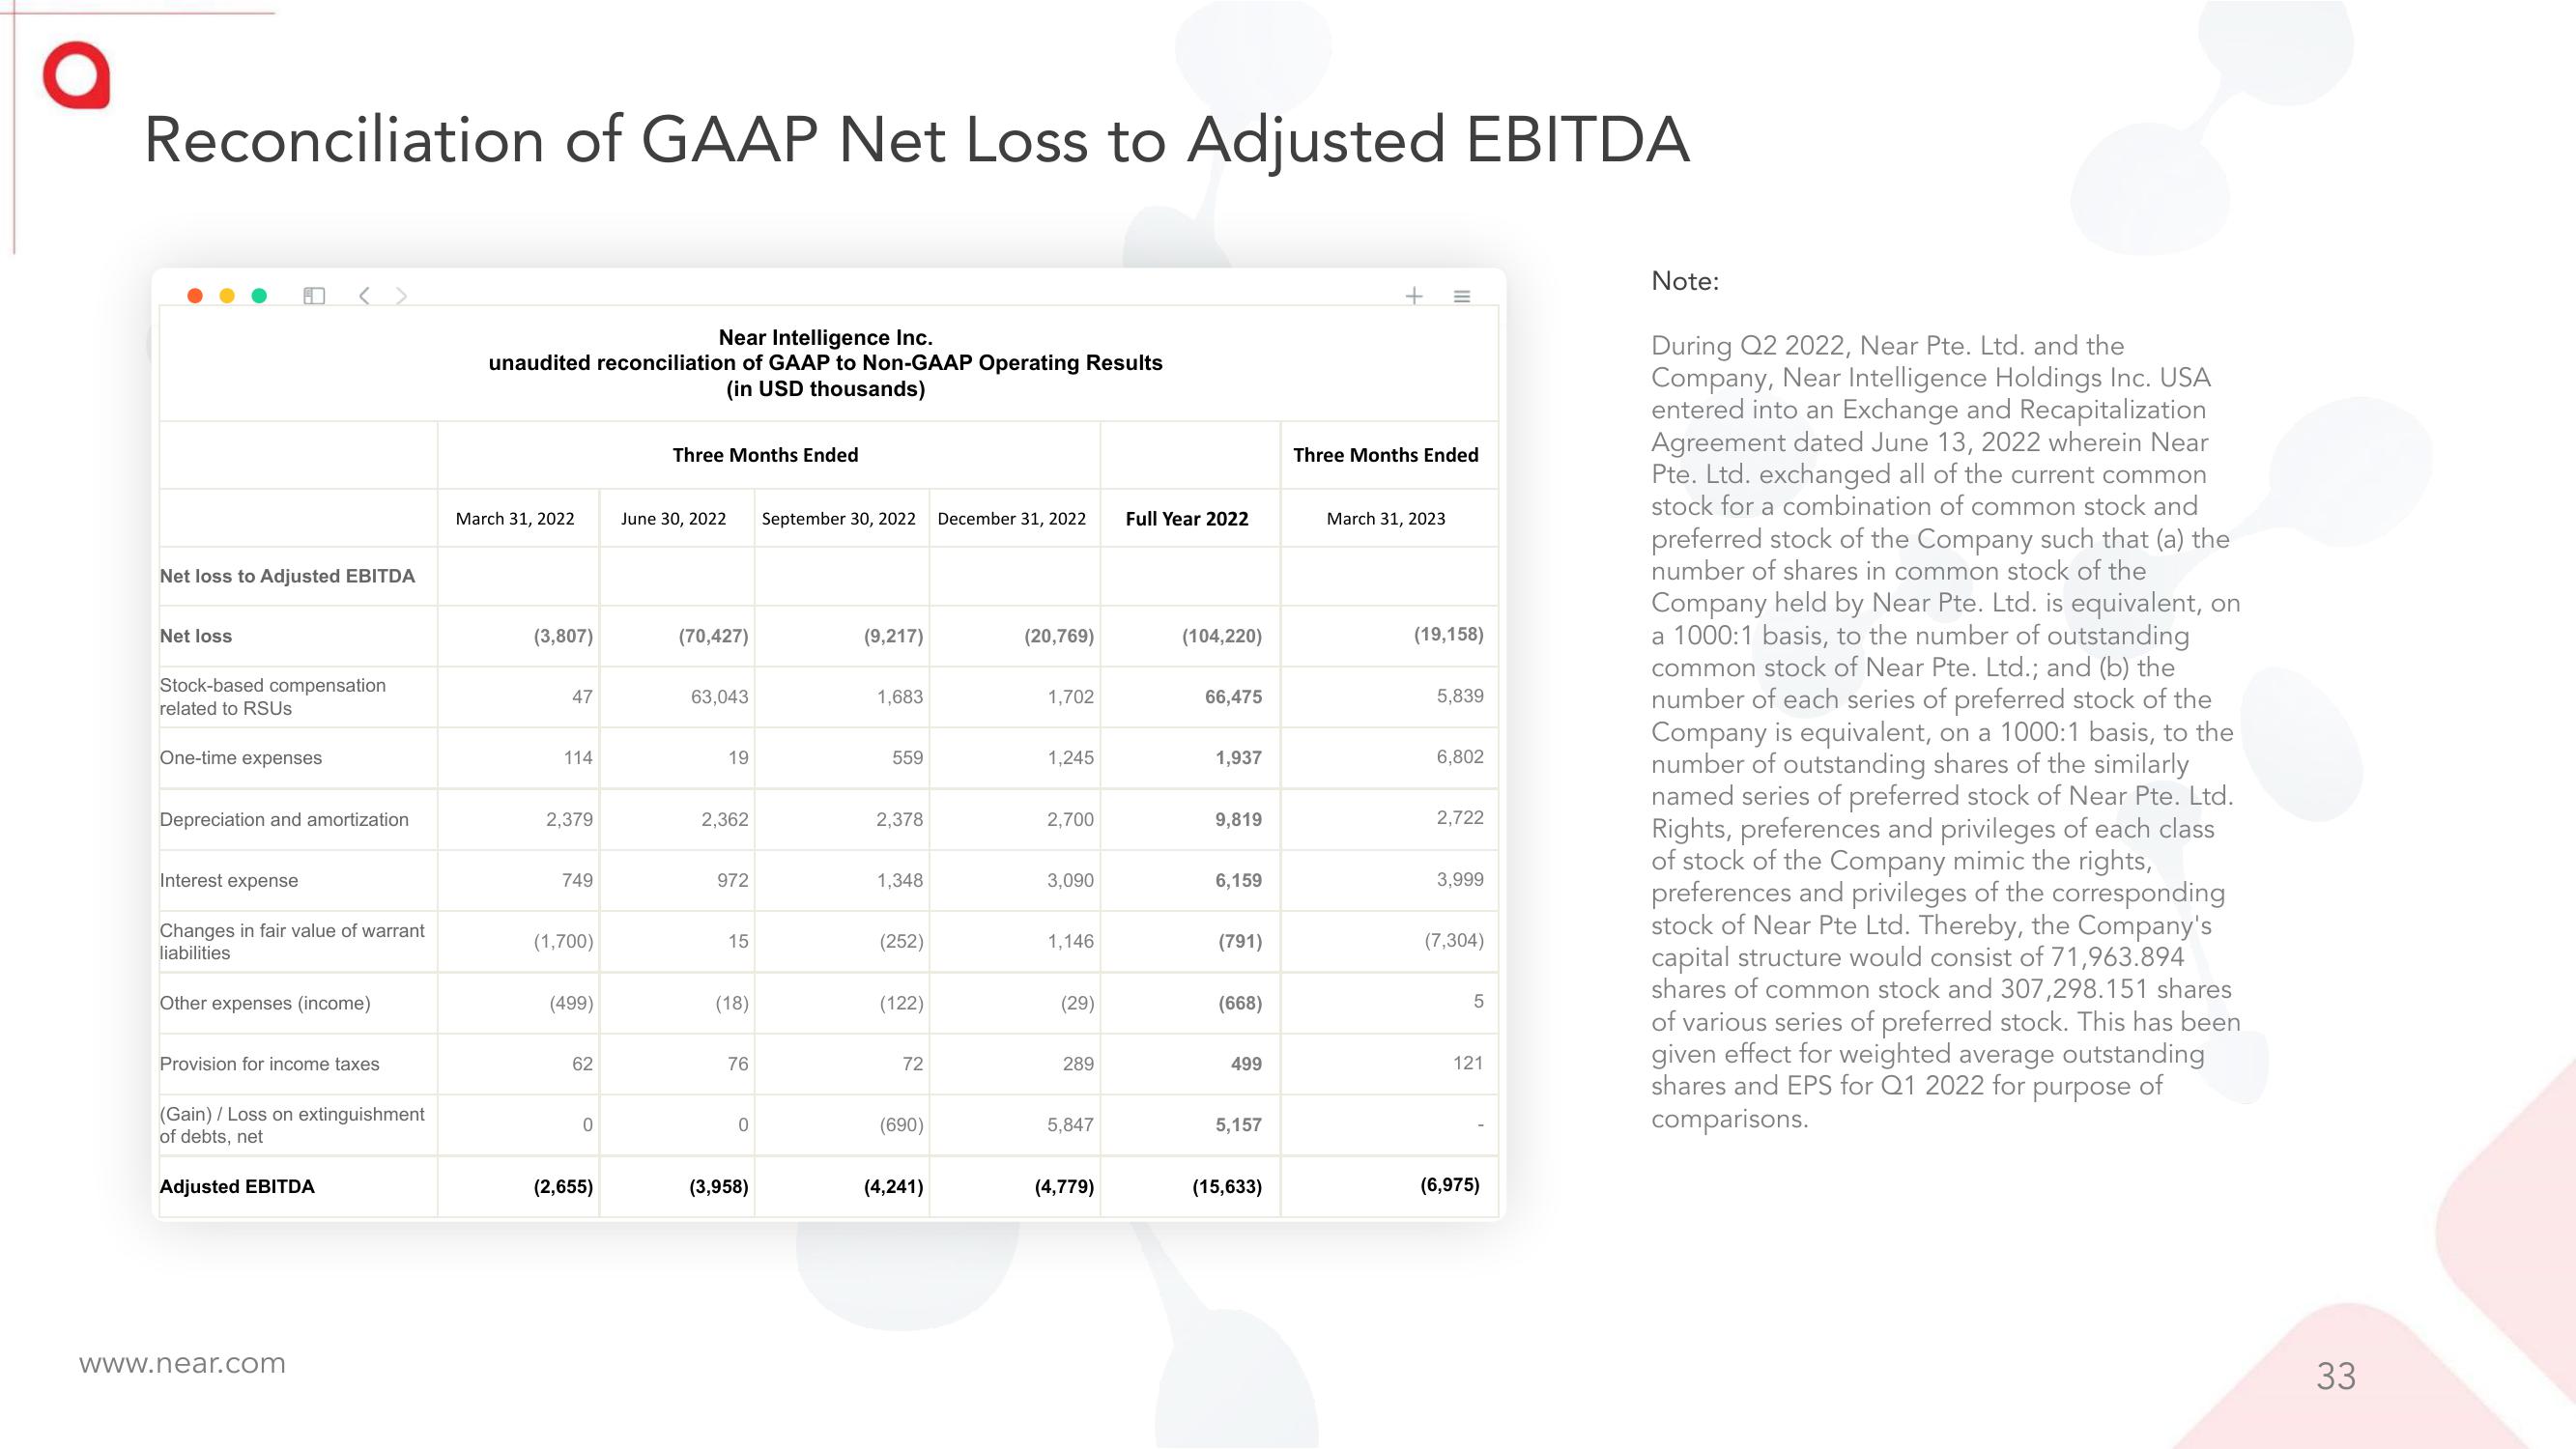
Reconciliation of GAAP Net Loss to Adjusted EBITDA
Net loss to Adjusted EBITDA
Net loss
Stock-based compensation
related to RSUS
One-time expenses
Depreciation and amortization
Interest expense
Changes in fair value of warrant
liabilities
Other expenses (income)
Provision for income taxes
(Gain) / Loss on extinguishment
of debts, net
Adjusted EBITDA
www.near.com
Near Intelligence Inc.
unaudited reconciliation of GAAP to Non-GAAP Operating Results
(in USD thousands)
March 31, 2022
(3,807)
47
114
2,379
749
(1,700)
(499)
62
0
(2,655)
Three Months Ended
June 30, 2022 September 30, 2022
(70,427)
63,043
19
2,362
972
15
(18)
76
0
(3,958)
(9,217)
1,683
559
2,378
1,348
(252)
(122)
72
(690)
(4,241)
December 31, 2022
(20,769)
1,702
1,245
2,700
3,090
1,146
(29)
289
5,847
(4,779)
Full Year 2022
(104,220)
66,475
1,937
9,819
6,159
(791)
(668)
499
5,157
(15,633)
+
Three Months Ended
March 31, 2023
(19,158)
5,839
6,802
2,722
3,999
(7,304)
5
121
(6,975)
Note:
During Q2 2022, Near Pte. Ltd. and the
Company, Near Intelligence Holdings Inc. USA
entered into an Exchange and Recapitalization
Agreement dated June 13, 2022 wherein Near
Pte. Ltd. exchanged all of the current common
stock for a combination of common stock and
preferred stock of the Company such that (a) the
number of shares in common stock of the
Company held by Near Pte. Ltd. is equivalent, on
a 1000:1 basis, to the number of outstanding
common stock of Near Pte. Ltd.; and (b) the
number of each series of preferred stock of the
Company is equivalent, on a 1000:1 basis, to the
number of outstanding shares of the similarly
named series of preferred stock of Near Pte. Ltd.
Rights, preferences and privileges of each class
of stock of the Company mimic the rights,
preferences and privileges of the corresponding
stock of Near Pte Ltd. Thereby, the Company's
capital structure would consist of 71,963.894
shares of common stock and 307,298.151 shares
of various series of preferred stock. This has been
given effect for weighted average outstanding
shares and EPS for Q1 2022 for purpose of
comparisons.
33View entire presentation