Goldman Sachs Results Presentation Deck
Commercial Real Estate (CRE)
●
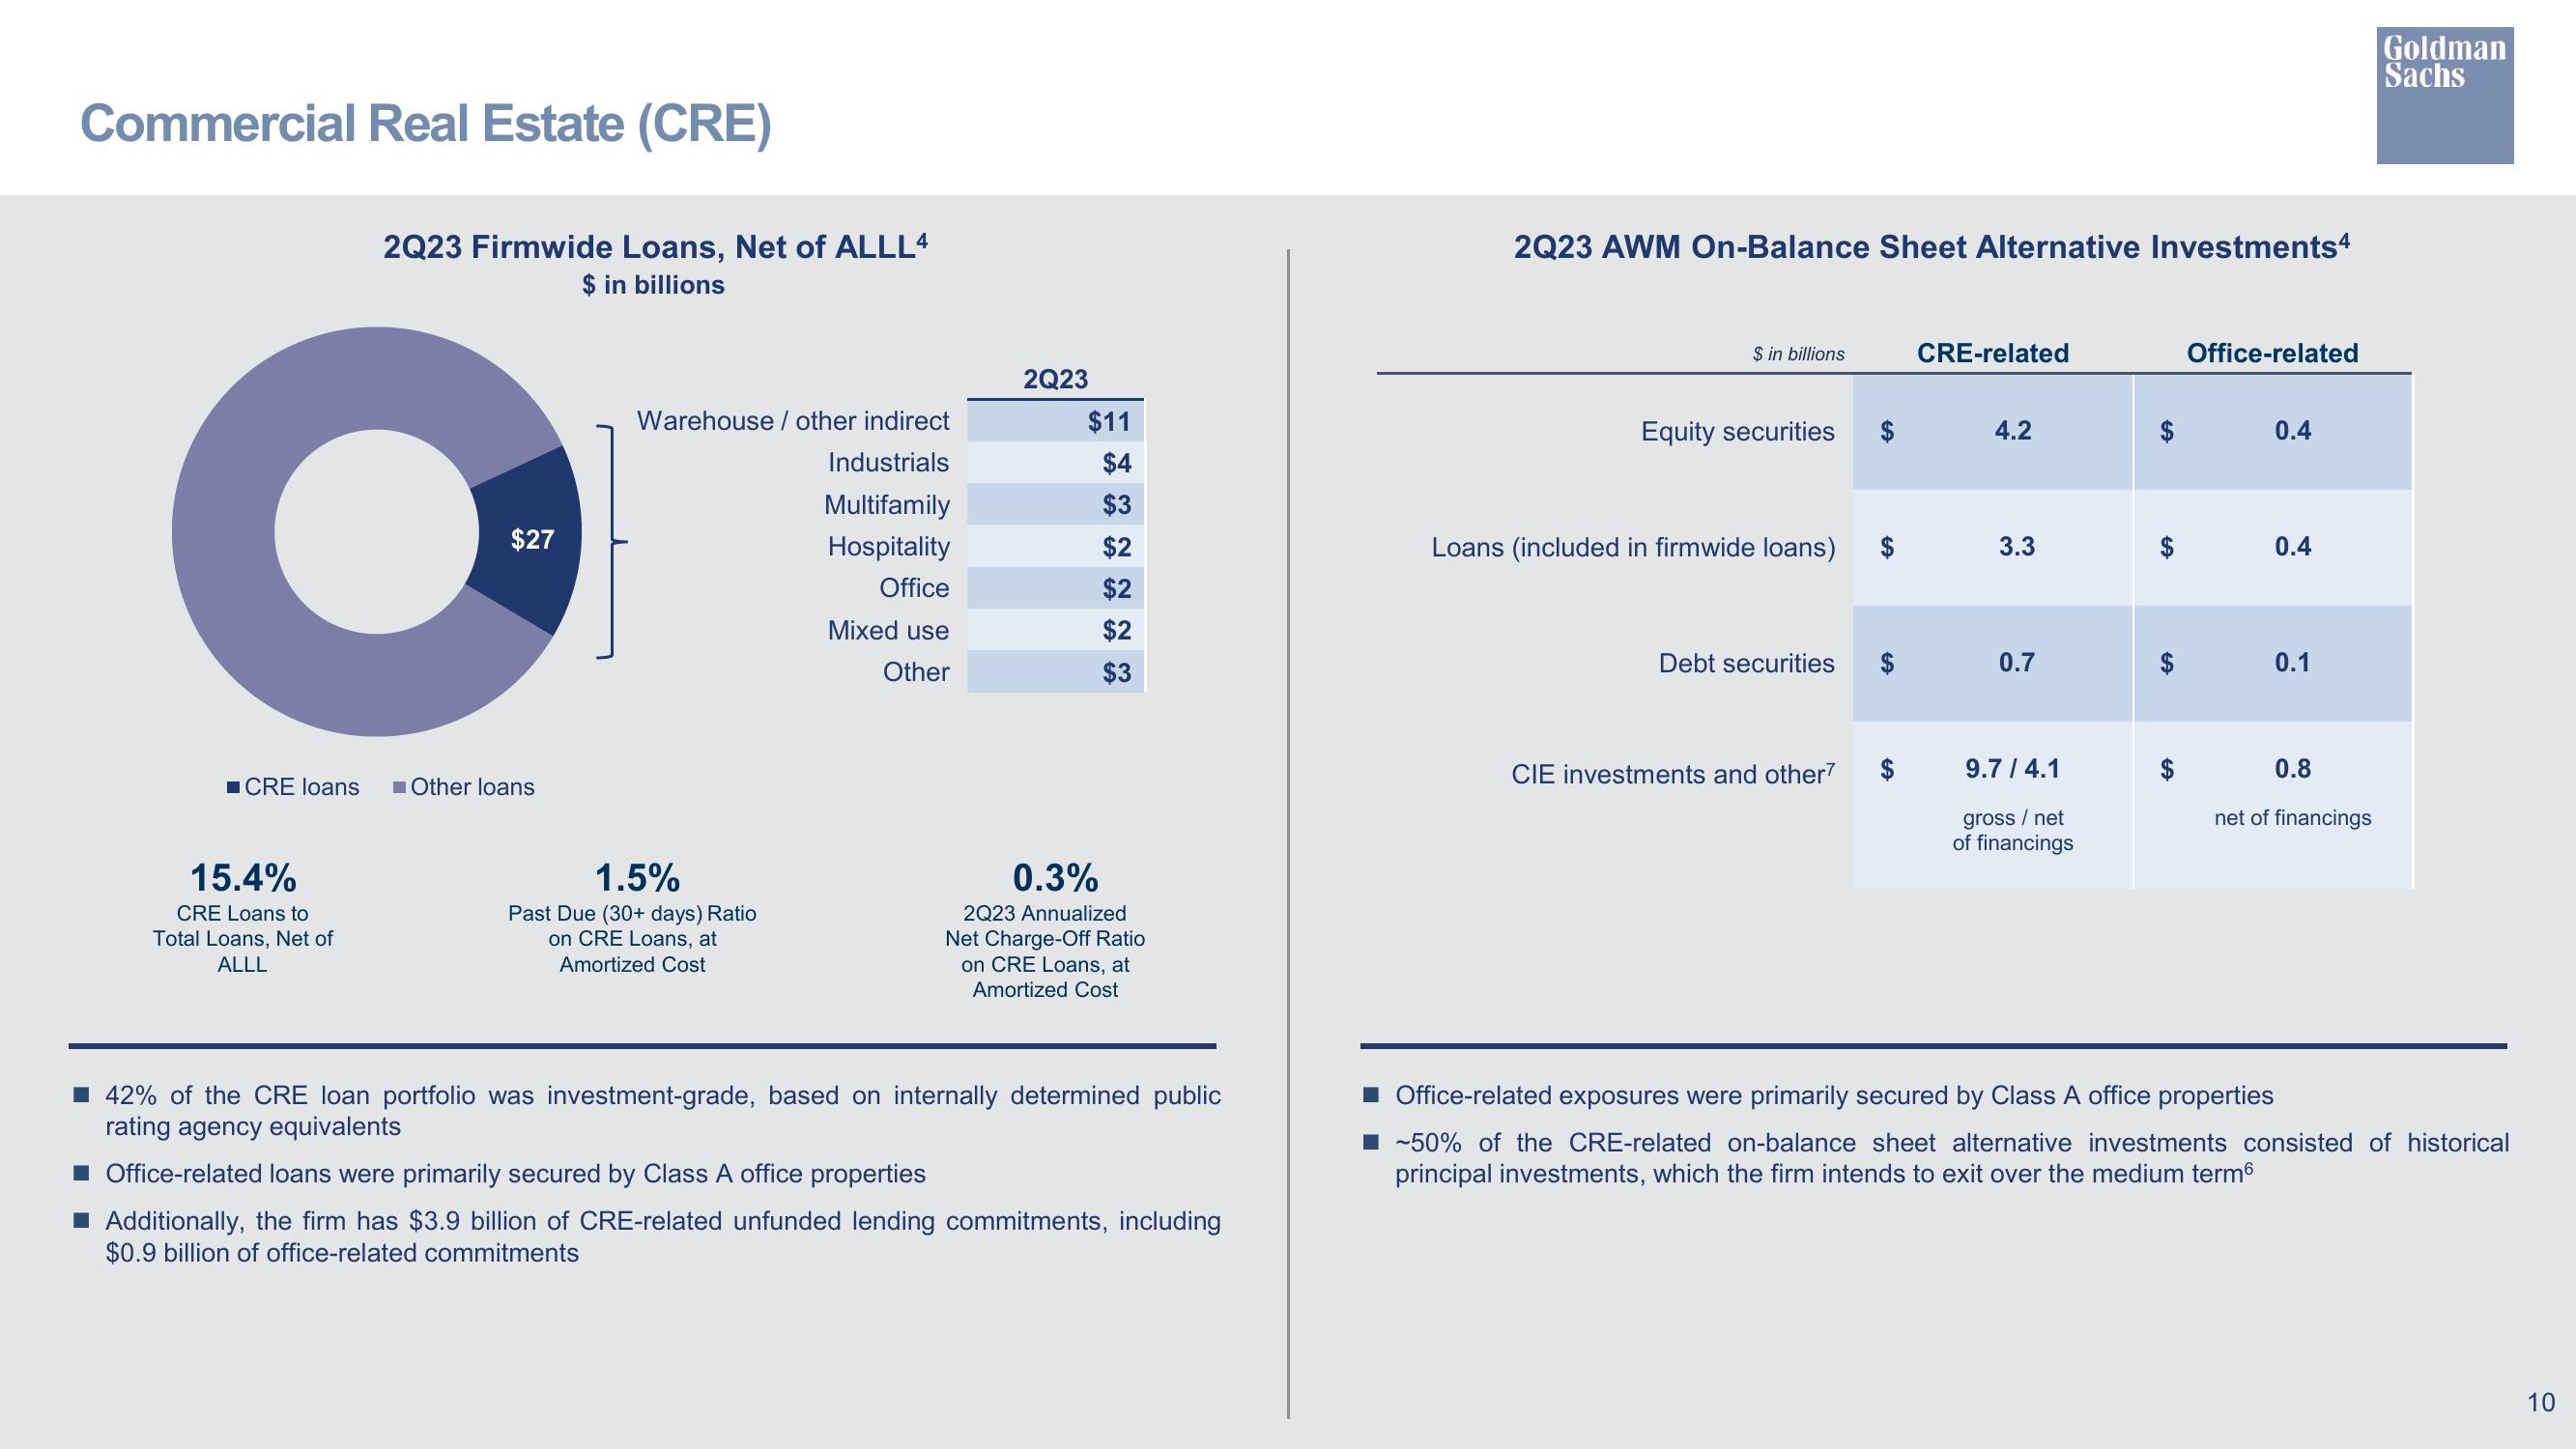
$27
■CRE loans
2Q23 Firmwide Loans, Net of ALLL4
$ in billions
15.4%
CRE Loans to
Total Loans, Net of
ALLL
Other loans
Warehouse / other indirect
Industrials
Multifamily
Hospitality
Office
Mixed use
Other
1.5%
Past Due (30+ days) Ratio
on CRE Loans, at
Amortized Cost
2Q23
$11
$4
$3
$2
$2
$2
$3
0.3%
2Q23 Annualized
Net Charge-Off Ratio
on CRE Loans, at
Amortized Cost
■ 42% of the CRE loan portfolio was investment-grade, based on internally determined public
rating agency equivalents
■ Office-related loans were primarily secured by Class A office properties
■ Additionally, the firm has $3.9 billion of CRE-related unfunded lending commitments, including
$0.9 billion of office-related commitments
2Q23 AWM On-Balance Sheet Alternative Investments4
$ in billions
Equity securities
Loans (included in firmwide loans) $
Debt securities
CIE investments and other7
CRE-related
4.2
3.3
0.7
9.7 / 4.1
gross / net
of financings
SA
Office-related
0.4
0.4
0.1
0.8
net of financings
Goldman
Sachs
■ Office-related exposures were primarily secured by Class A office properties
■ ~50% of the CRE-related on-balance sheet alternative investments consisted of historical
principal investments, which the firm intends to exit over the medium term
10View entire presentation