Prudential Financial, Inc. 2018 Tokyo Investor Day
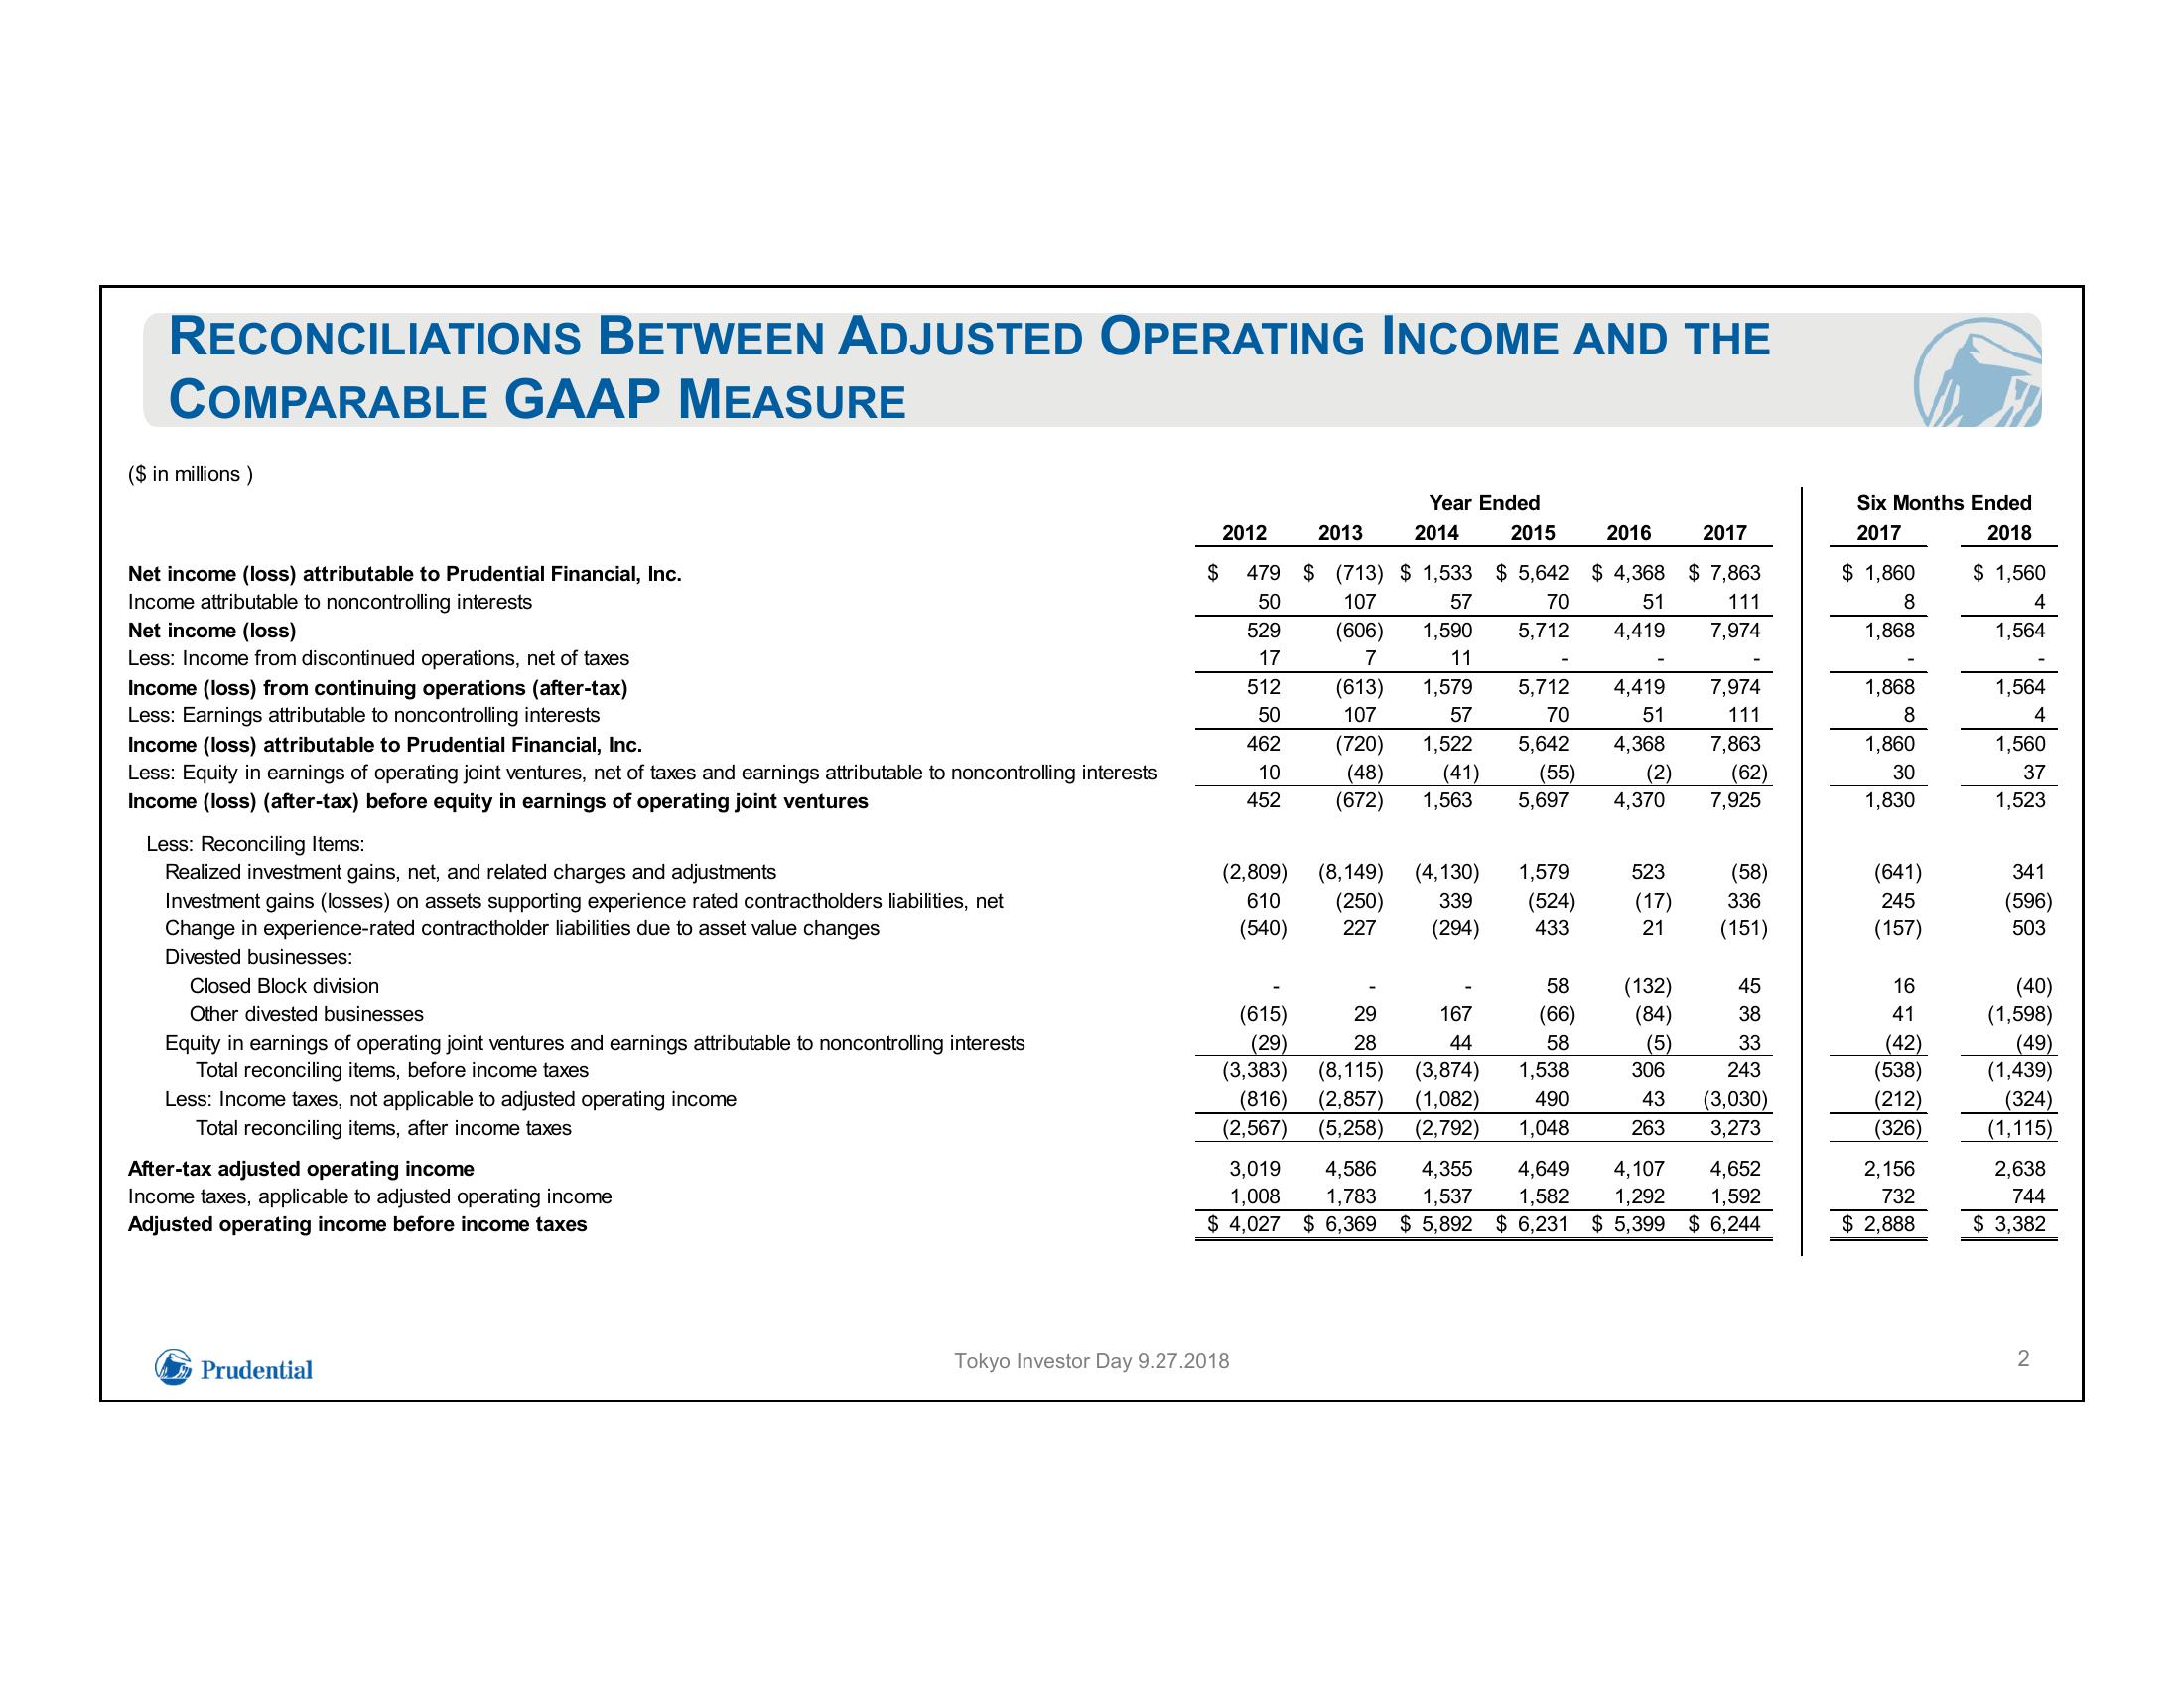
RECONCILIATIONS BETWEEN ADJUSTED OPERATING INCOME AND THE
COMPARABLE GAAP MEASURE
($ in millions)
Net income (loss) attributable to Prudential Financial, Inc.
Income attributable to noncontrolling interests
Net income (loss)
Less: Income from discontinued operations, net of taxes
Income (loss) from continuing operations (after-tax)
Less: Earnings attributable to noncontrolling interests
Income (loss) attributable to Prudential Financial, Inc.
Less: Equity in earnings of operating joint ventures, net of taxes and earnings attributable to noncontrolling interests
Income (loss) (after-tax) before equity in earnings of operating joint ventures
Less: Reconciling Items:
Realized investment gains, net, and related charges and adjustments
Investment gains (losses) on assets supporting experience rated contractholders liabilities, net
Change in experience-rated contractholder liabilities due to asset value changes
Divested businesses:
Closed Block division
Other divested businesses
Equity in earnings of operating joint ventures and earnings attributable to noncontrolling interests
Total reconciling items, before income taxes
Less: Income taxes, not applicable to adjusted operating income
Total reconciling items, after income taxes
After-tax adjusted operating income
Income taxes, applicable to adjusted operating income
Adjusted operating income before income taxes
Prudential
$
2012
2013
2015
2016
2017
479 $ (713) $1,533 $5,642 $4,368 $ 7,863
50
107
57
70
51
111
(606) 1,590 5,712 4,419 7,974
7
(613)
107
529
17
512
50
462
10
11
1,579
57
1,522
(48) (41)
(672) 1,563
(720)
452
(2,809)
610
(540)
Year Ended
(250)
227
Tokyo Investor Day 9.27.2018
(8,149) (4,130)
29
28
2014
5,712 4,419
70
51
5,642 4,368
(55) (2)
5,697 4,370
1,579
339 (524)
(294) 433
(615)
(29)
(3,383) (8,115) (3,874) 1,538
(816) (2,857) (1,082) 490
(2,567) (5,258) (2,792) 1,048
167
44
58
(66)
58
523
(17)
21
(132)
(84)
(5)
306
43
263
4,586 4,355 4,649 4,107
1,783 1,537 1,582 1,292
7,974
111
7,863
(62)
7,925
(58)
336
(151)
45
38
33
243
(3,030)
3,273
4,652
3,019
1,008
$ 4,027 $6,369 $5,892 $6,231 $5,399 $6,244
1,592
Six Months Ended
2017
2018
$ 1,860
8
1,868
1,868
8
1,860
30
1,830
(641)
245
(157)
16
41
(42)
(538)
(212)
(326)
2,156
732
$ 2,888
$ 1,560
4
1,564
1,564
1,560
37
1,523
341
0990
(596)
503
(40)
(1,598)
(49)
(1,439)
(324)
(1,115)
2,638
744
$ 3,382
2View entire presentation