Hostess SPAC Presentation Deck
PAGE
12
STRONG MOMENTUM CONTINUES IN Q3 2016
Net Revenue
($ in millions)
$498
24
474
YTD '15
Adj. EBITDA
($ in millions)
$139
3
13%
136
18%
YTD '15
$563
14
549
YTD '16
$164
2
162
YTD '16
I
$166
8
158
Q3 '15
$42
1
41
Q3 '15
18%
34%
$196
196
Q3 '16
$56
56
Q3 '16
Hostess (2)
Gross Profit(1)
($ in millions)
$209
5
204
YTD '15
16%
27.9%
YTD '15
Superior (3)
$243
4
Adj. EBITDA Margin
239
YTD '16
29.2%
YTD '16
$64
2
62
Q3 '15
25.1%
Q3 '15
29%
$83
83
Q3 '16
28.4%
Q3 '16
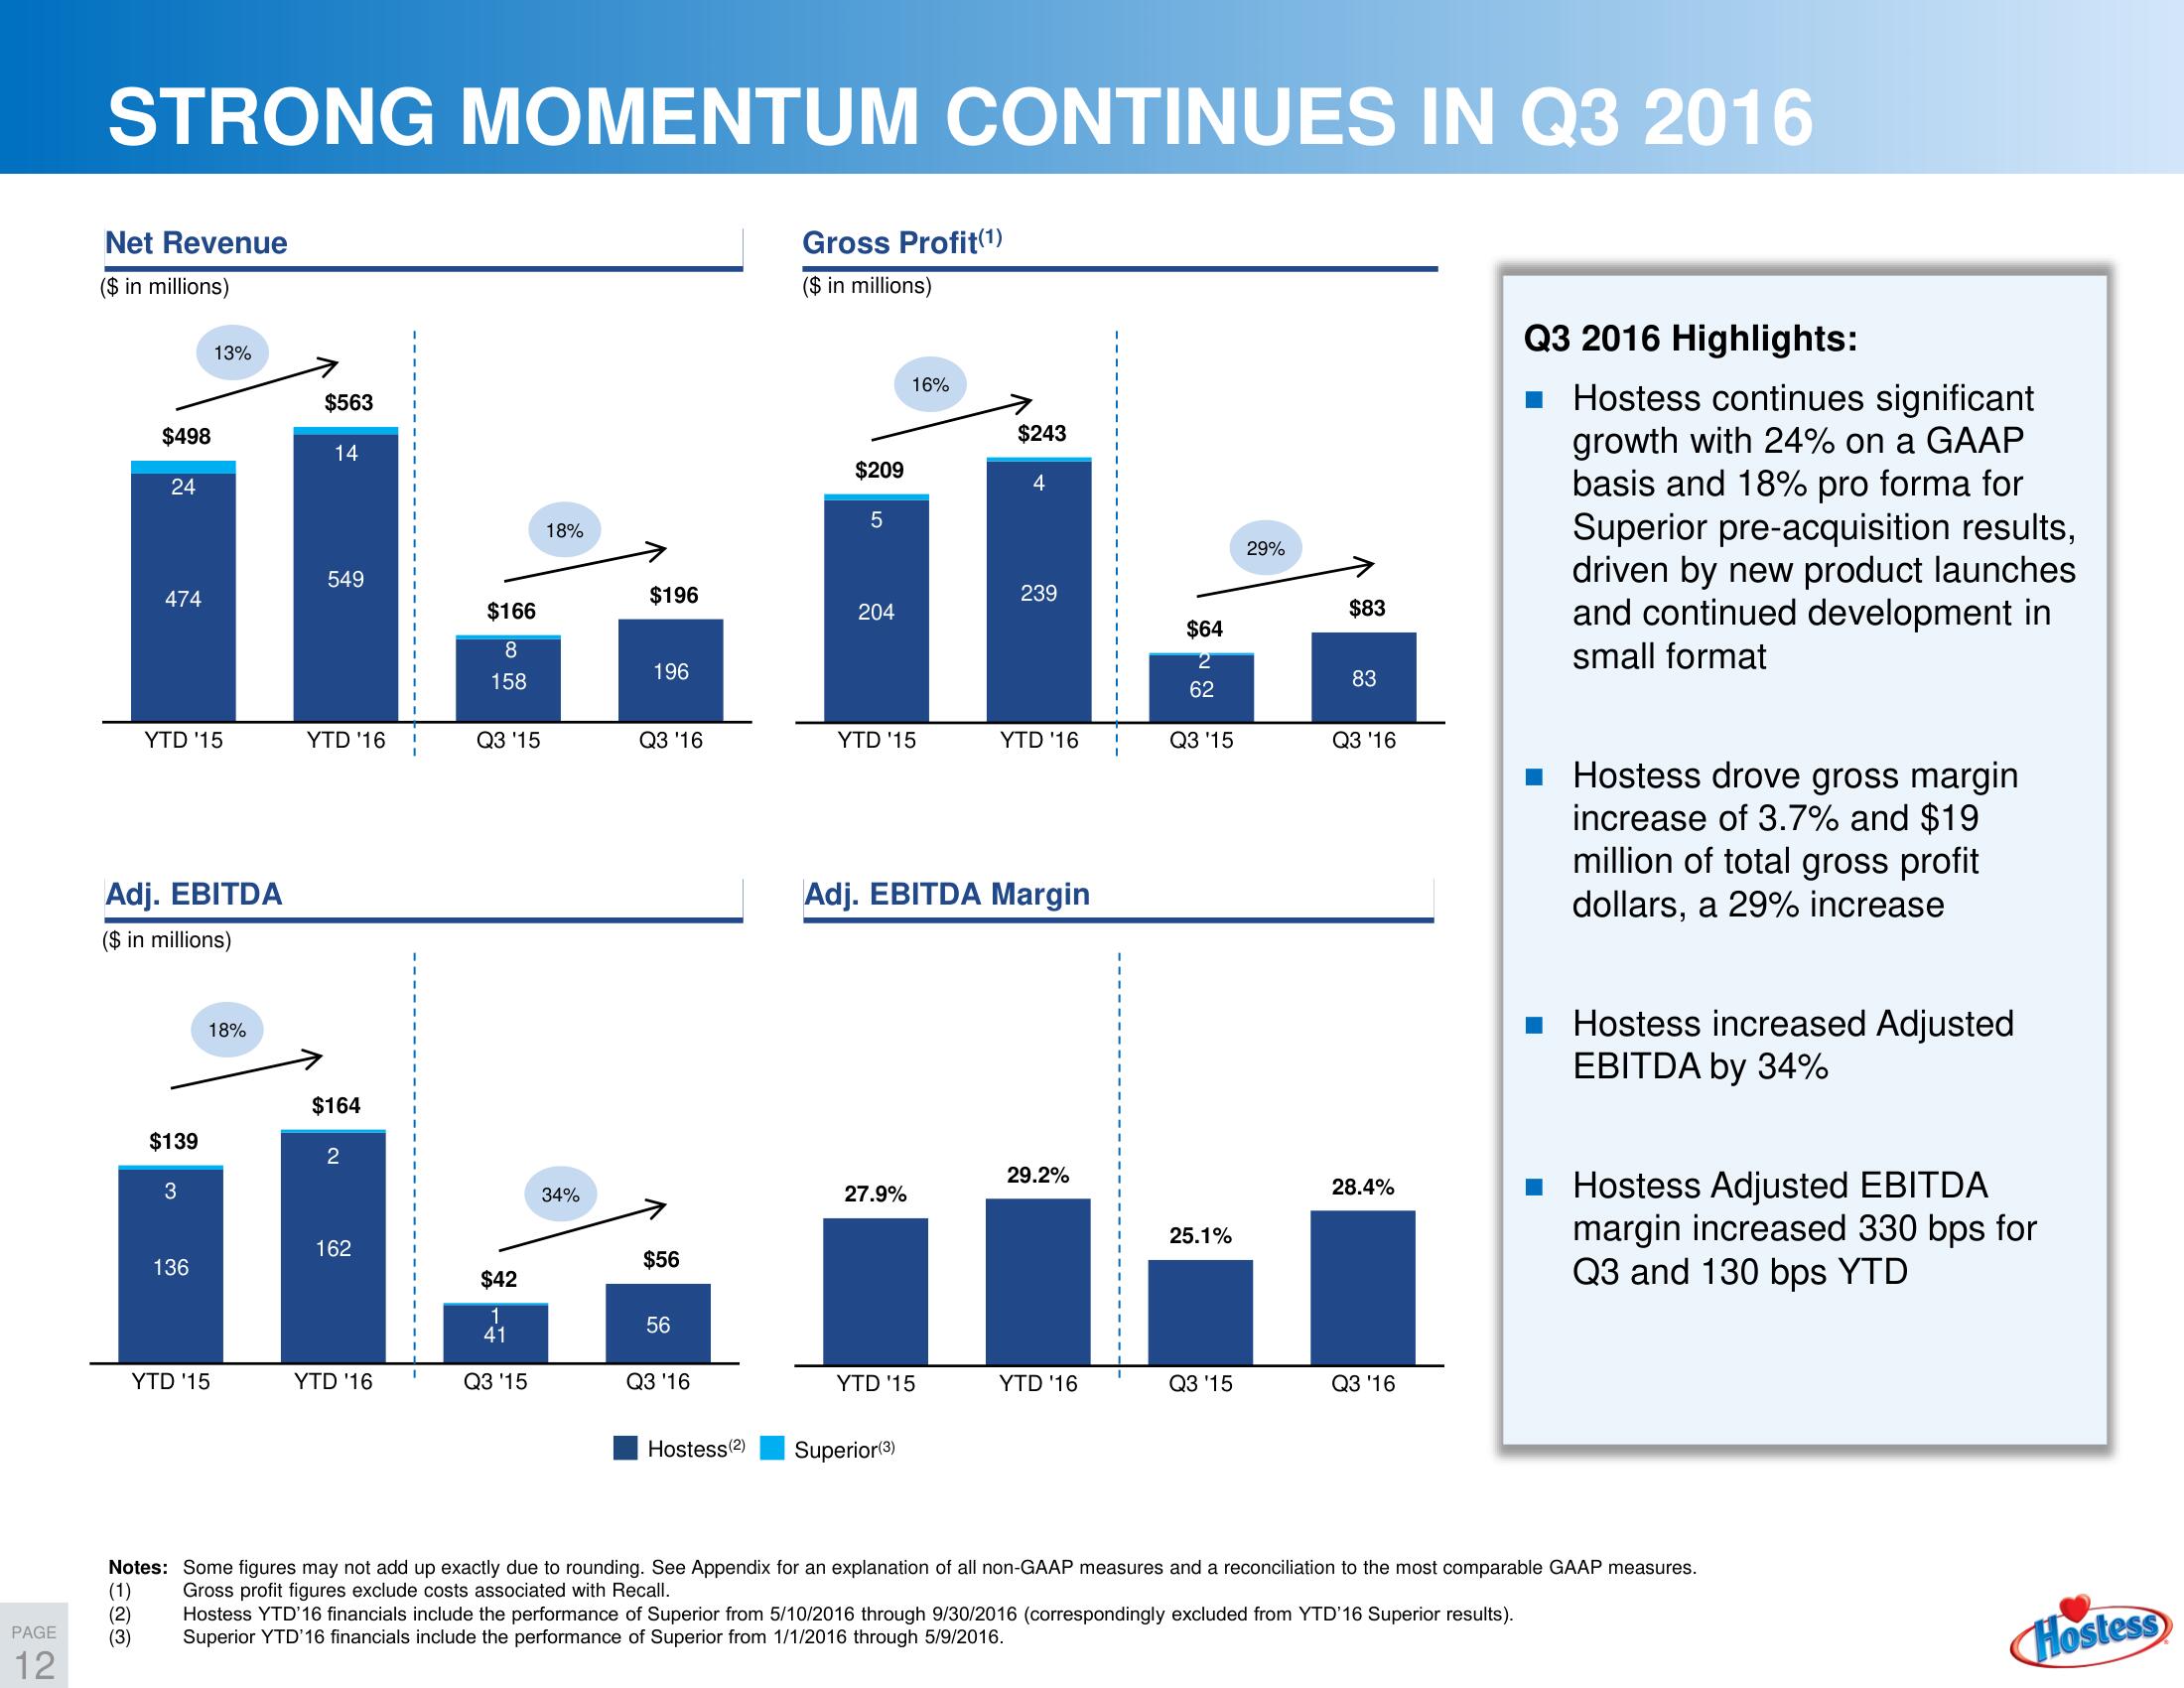
Q3 2016 Highlights:
Hostess continues significant
growth with 24% on a GAAP
basis and 18% pro forma for
Superior pre-acquisition results,
driven by new product launches
and continued development in
small format
Hostess drove gross margin
increase of 3.7% and $19
million of total gross profit
dollars, a 29% increase
Hostess increased Adjusted
EBITDA by 34%
Hostess Adjusted EBITDA
margin increased 330 bps for
Q3 and 130 bps YTD
Notes: Some figures may not add up exactly due to rounding. See Appendix for an explanation of all non-GAAP measures and a reconciliation to the most comparable GAAP measures.
(1) Gross profit figures exclude costs associated with Recall.
(2)
Hostess YTD'16 financials include the performance of Superior from 5/10/2016 through 9/30/2016 (correspondingly excluded from YTD'16 Superior results).
Superior YTD 16 financials include the performance of Superior from 1/1/2016 through 5/9/2016.
(3)
HostessView entire presentation