Morgan Stanley Investment Banking Pitch Book
Project Roosevelt
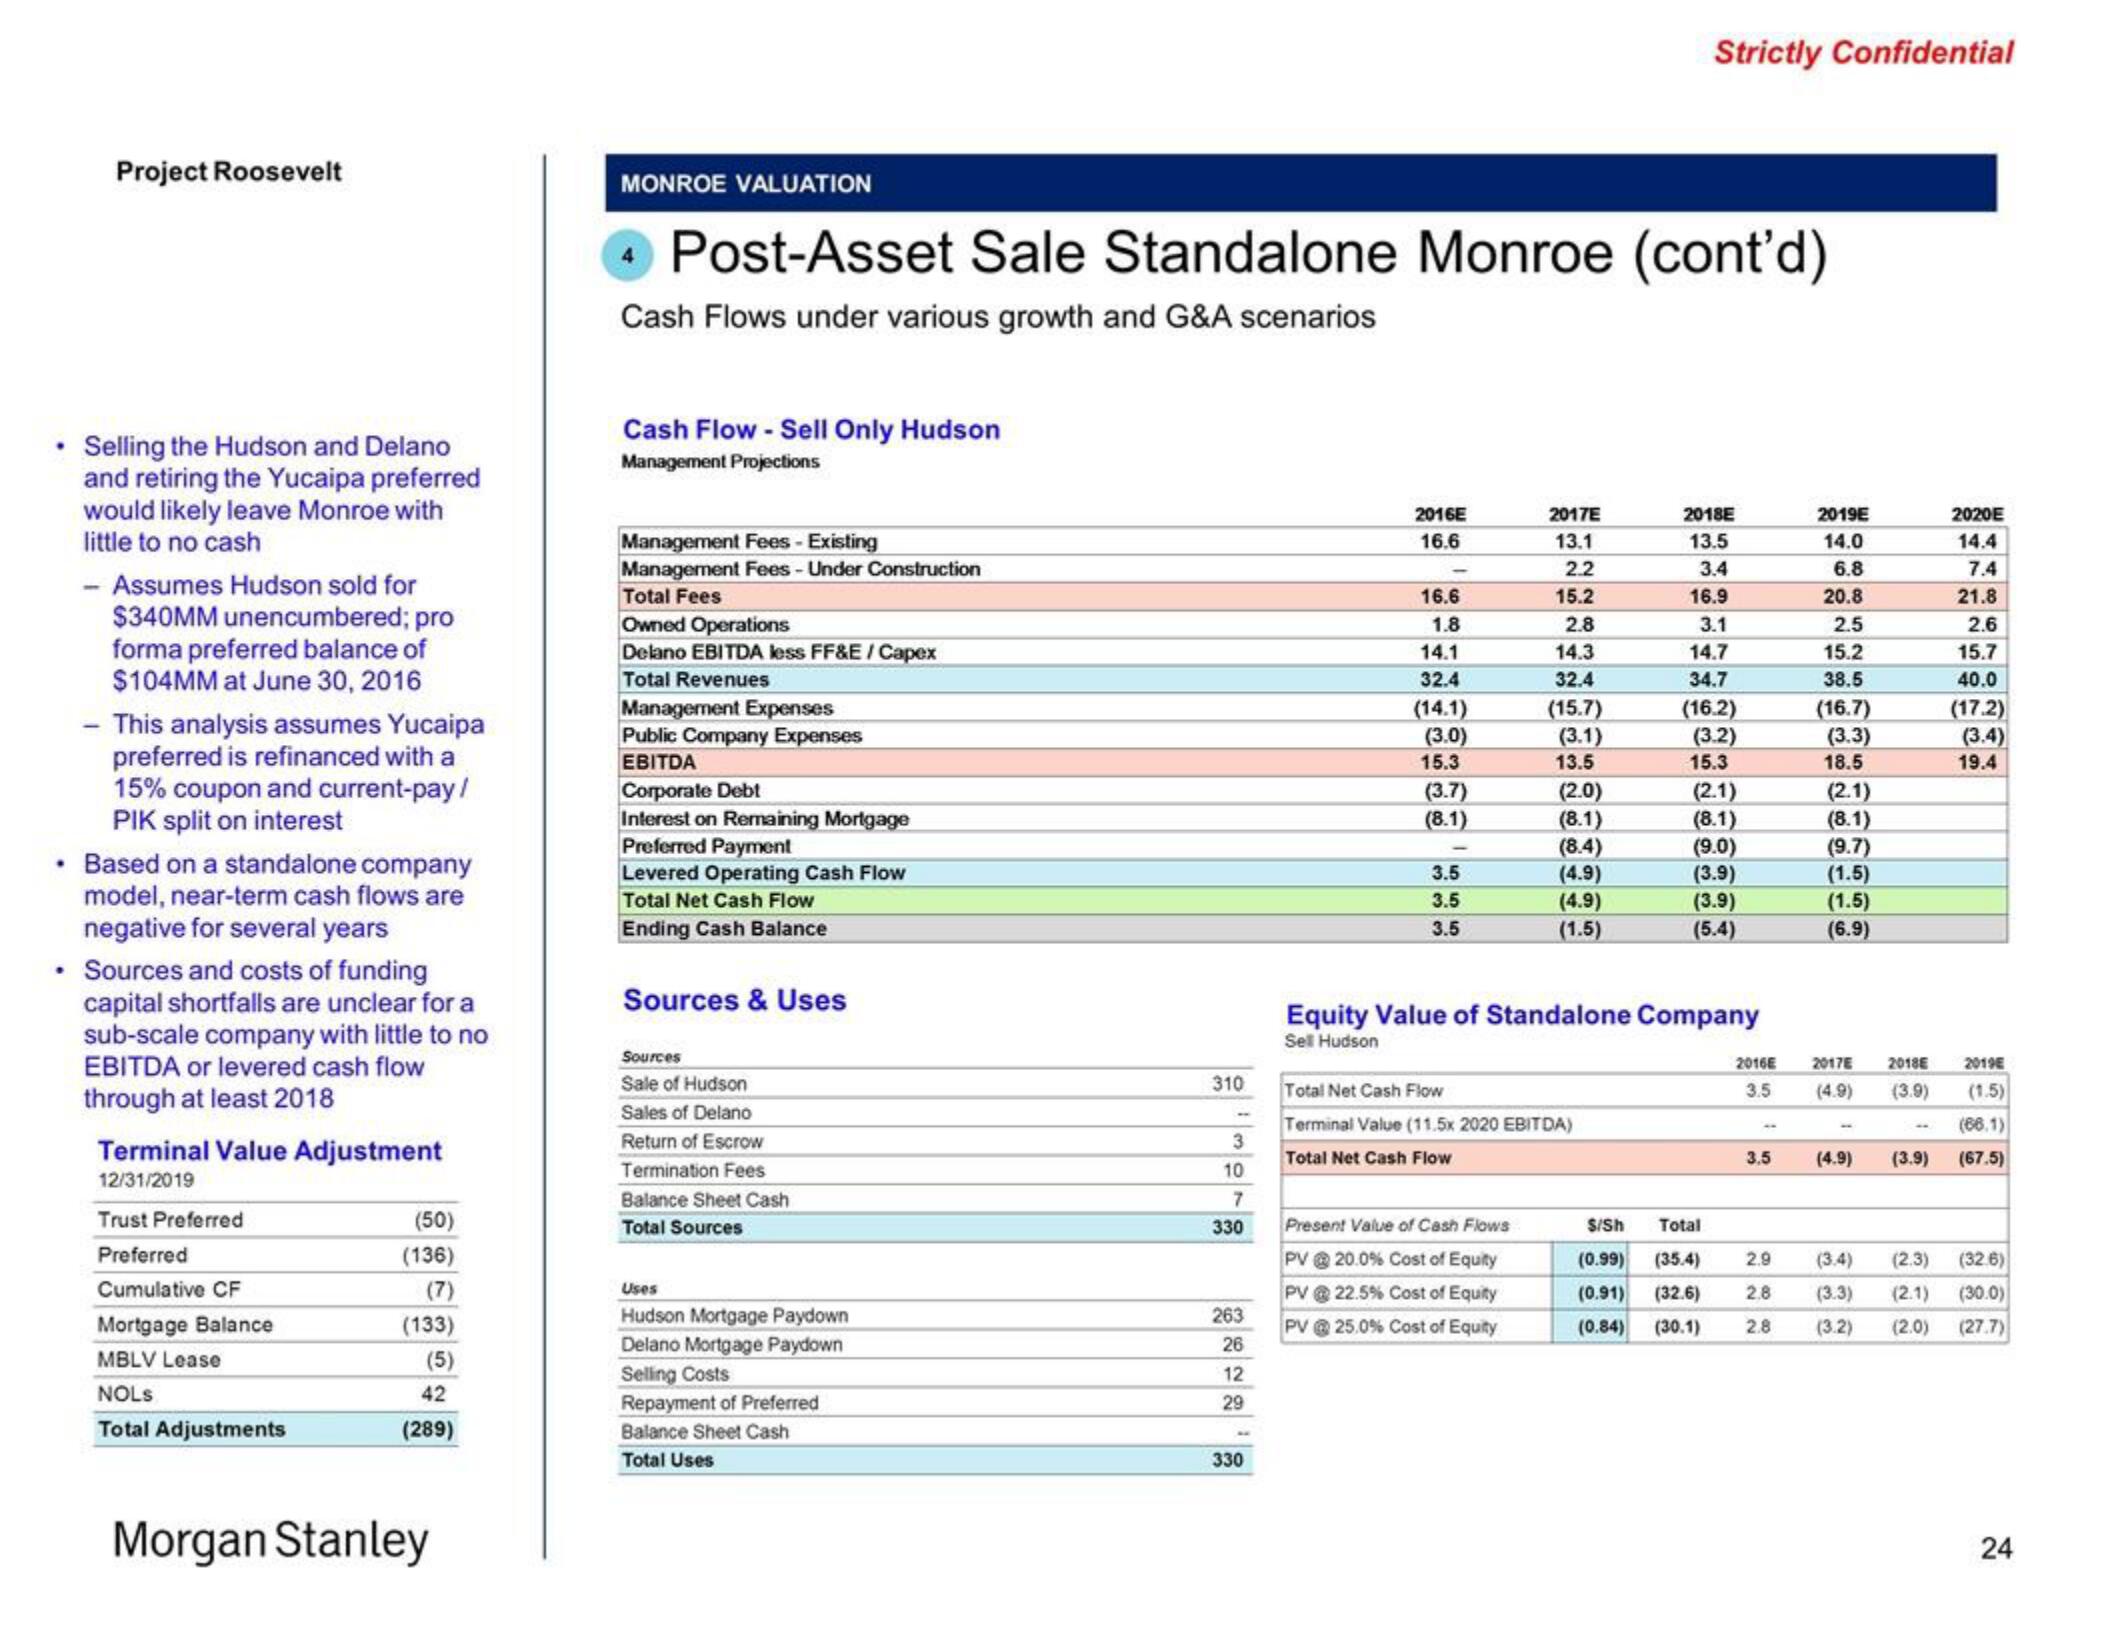
• Selling the Hudson and Delano
and retiring the Yucaipa preferred
would likely leave Monroe with
little to no cash
- Assumes Hudson sold for
$340MM unencumbered; pro
forma preferred balance of
$104MM at June 30, 2016
- This analysis assumes Yucaipa
preferred is refinanced with a
15% coupon and current-pay/
PIK split on interest
.
• Based on a standalone company
model, near-term cash flows are
negative for several years
• Sources and costs of funding
capital shortfalls are unclear for
sub-scale company with little to no
EBITDA or levered cash flow
through at least 2018
Terminal Value Adjustment
12/31/2019
Trust Preferred
Preferred
Cumulative CF
Mortgage Balance
MBLV Lease
NOLS
Total Adjustments
(50)
(136)
(7)
(133)
(5)
42
(289)
Morgan Stanley
MONROE VALUATION
Post-Asset Sale Standalone Monroe (cont'd)
Cash Flows under various growth and G&A scenarios
Cash Flow - Sell Only Hudson
Management Projections
Management Fees - Existing
Management Fees - Under Construction
Total Fees
Owned Operations
Delano EBITDA less FF&E / Capex
Total Revenues
Management Expenses
Public Company Expenses
EBITDA
Corporate Debt
Interest on Remaining Mortgage
Preferred Payment
Levered Operating Cash Flow
Total Net Cash Flow
Ending Cash Balance
Sources & Uses
Sources
Sale of Hudson
Sales of Delano
Return of Escrow
Termination Fees
Balance Sheet Cash
Total Sources
Uses
Hudson Mortgage Paydown
Delano Mortgage Paydown
Selling Costs
Repayment of Preferred
Balance Sheet Cash
Total Uses
310
3
10
7
330
263
26
12
29
330
2016E
16.6
16.6
1.8
14.1
32.4
(14.1)
(3.0)
15.3
(3.7)
(8.1)
3.5
3.5
3.5
2017E
13.1
2.2
15.2
2.8
14.3
32.4
(15.7)
(3.1)
13.5
(2.0)
(8.1)
(8.4)
(4.9)
(4.9)
(1.5)
Present Value of Cash Flows
PV 20.0% Cost of Equity
PV@ 22.5% Cost of Equity
[email protected]% Cost of Equity
Total Net Cash Flow
Terminal Value (11.5x 2020 EBITDA)
Total Net Cash Flow
Strictly Confidential
2018E
13.5
3.4
16.9
3.1
14.7
34.7
(16.2)
(3.2)
15.3
(2.1)
(8.1)
(9.0)
(3.9)
Equity Value of Standalone Company
Sell Hudson
(3.9)
(5.4)
$/Sh Total
(0.99) (35.4)
(0.91) (32.6)
(0.84) (30.1)
2016E
3.5
3.5
2019E
14.0
6.8
20.8
2.5
15.2
38.5
(16.7)
(3.3)
18.5
(2.1)
(8.1)
(9.7)
(1.5)
(1.5)
(6.9)
2017E
2018E
(4.9) (3.9)
(4.9)
(3.9)
2020E
14.4
7.4
21.8
2.6
15.7
40.0
(17.2)
(3.4)
19.4
2019E
(1.5)
(66.1)
(67.5)
2.9 (3.4) (2.3) (32.6)
2.8 (3.3) (2.1) (30.0)
2.8 (3.2) (2.0) (27.7)
24View entire presentation