Tradeweb Results Presentation Deck
Reconciliation of Non-GAAP Financial Measures cont. (s in thousands, except share and per share amounts)
18
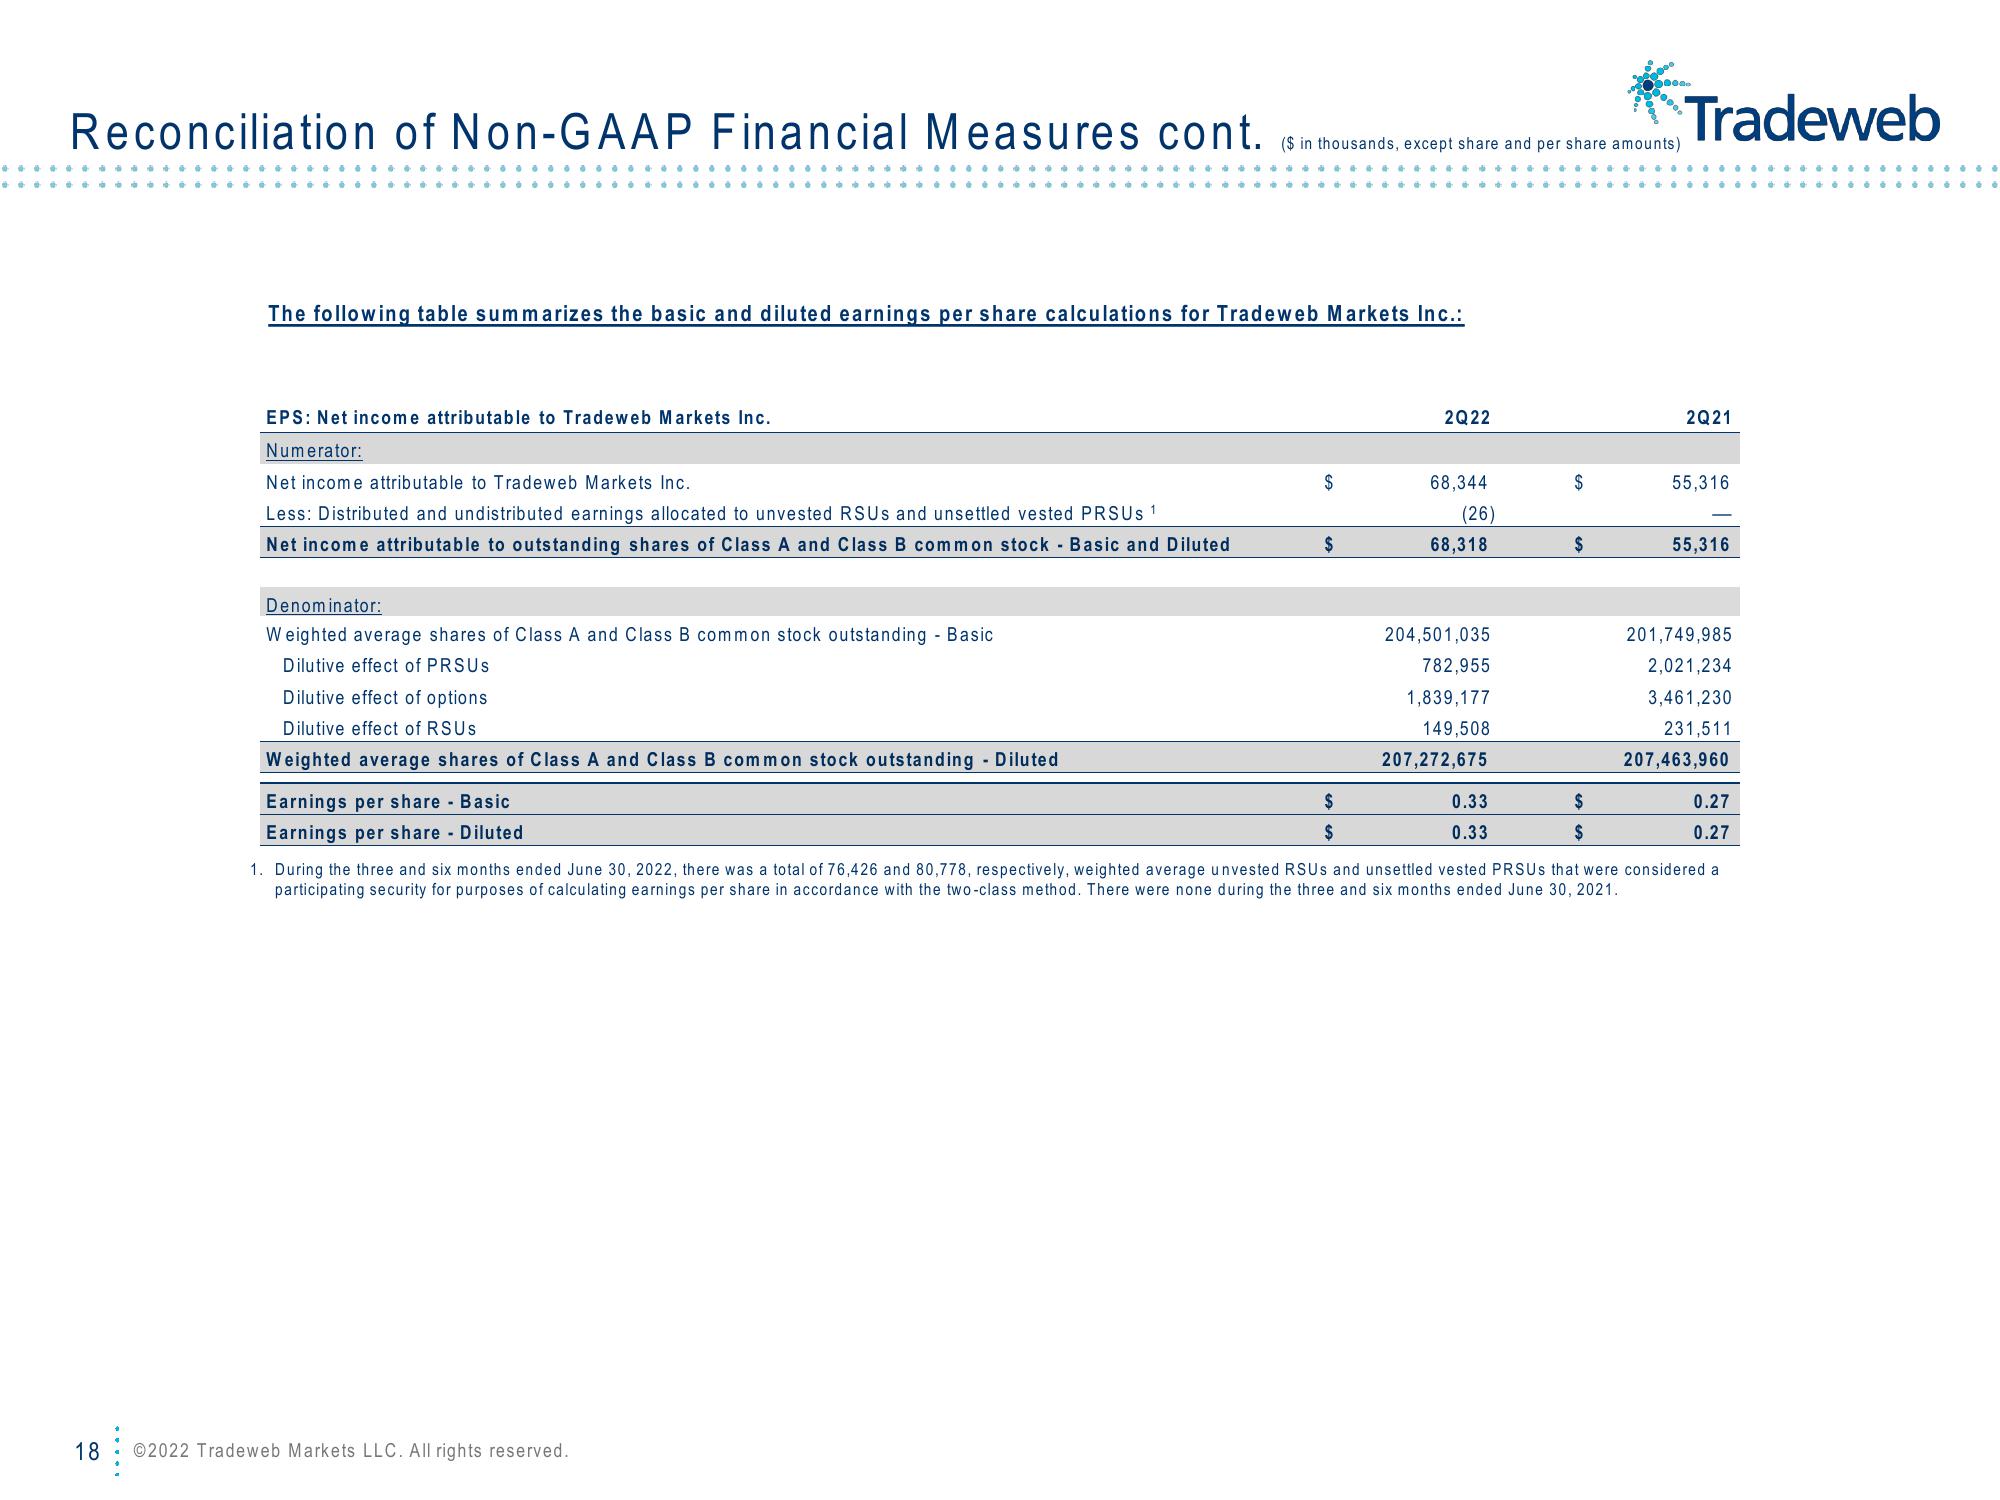
The following table summarizes the basic and diluted earnings per share calculations for Tradeweb Markets Inc.:
EPS: Net income attributable to Tradeweb Markets Inc.
Numerator:
Net income attributable to Tradeweb Markets Inc.
Less: Distributed and undistributed earnings allocated to unvested RSUS and unsettled vested PRSUS ¹
Net income attributable to outstanding shares of Class A and Class B common stock - Basic and Diluted
Denominator:
Weighted average shares of Class A and Class B common stock outstanding - Basic
Dilutive effect of PRSUS
Dilutive effect of options
Dilutive effect of RSUS
Weighted average shares of Class A and Class B common stock outstanding - Diluted
Earnings per share - Basic
Earnings per share - Diluted
$
©2022 Tradeweb Markets LLC. All rights reserved.
$
$
$
2Q22
68,344
(26)
68,318
204,501,035
782,955
1,839,177
149,508
207,272,675
0.33
0.33
$
$
****.
$
$
Tradeweb
2Q21
55,316
55,316
201,749,985
2,021,234
3,461,230
231,511
207,463,960
0.27
0.27
1. During the three and six months ended June 30, 2022, there was a total of 76,426 and 80,778, respectively, weighted average unvested RSUS and unsettled vested PRSUS that were considered a
participating security for purposes of calculating earnings per share in accordance with the two-class method. There were none during the three and six months ended June 30, 2021.View entire presentation