Investor Presentation
Q3'21 Key Performance Metrics
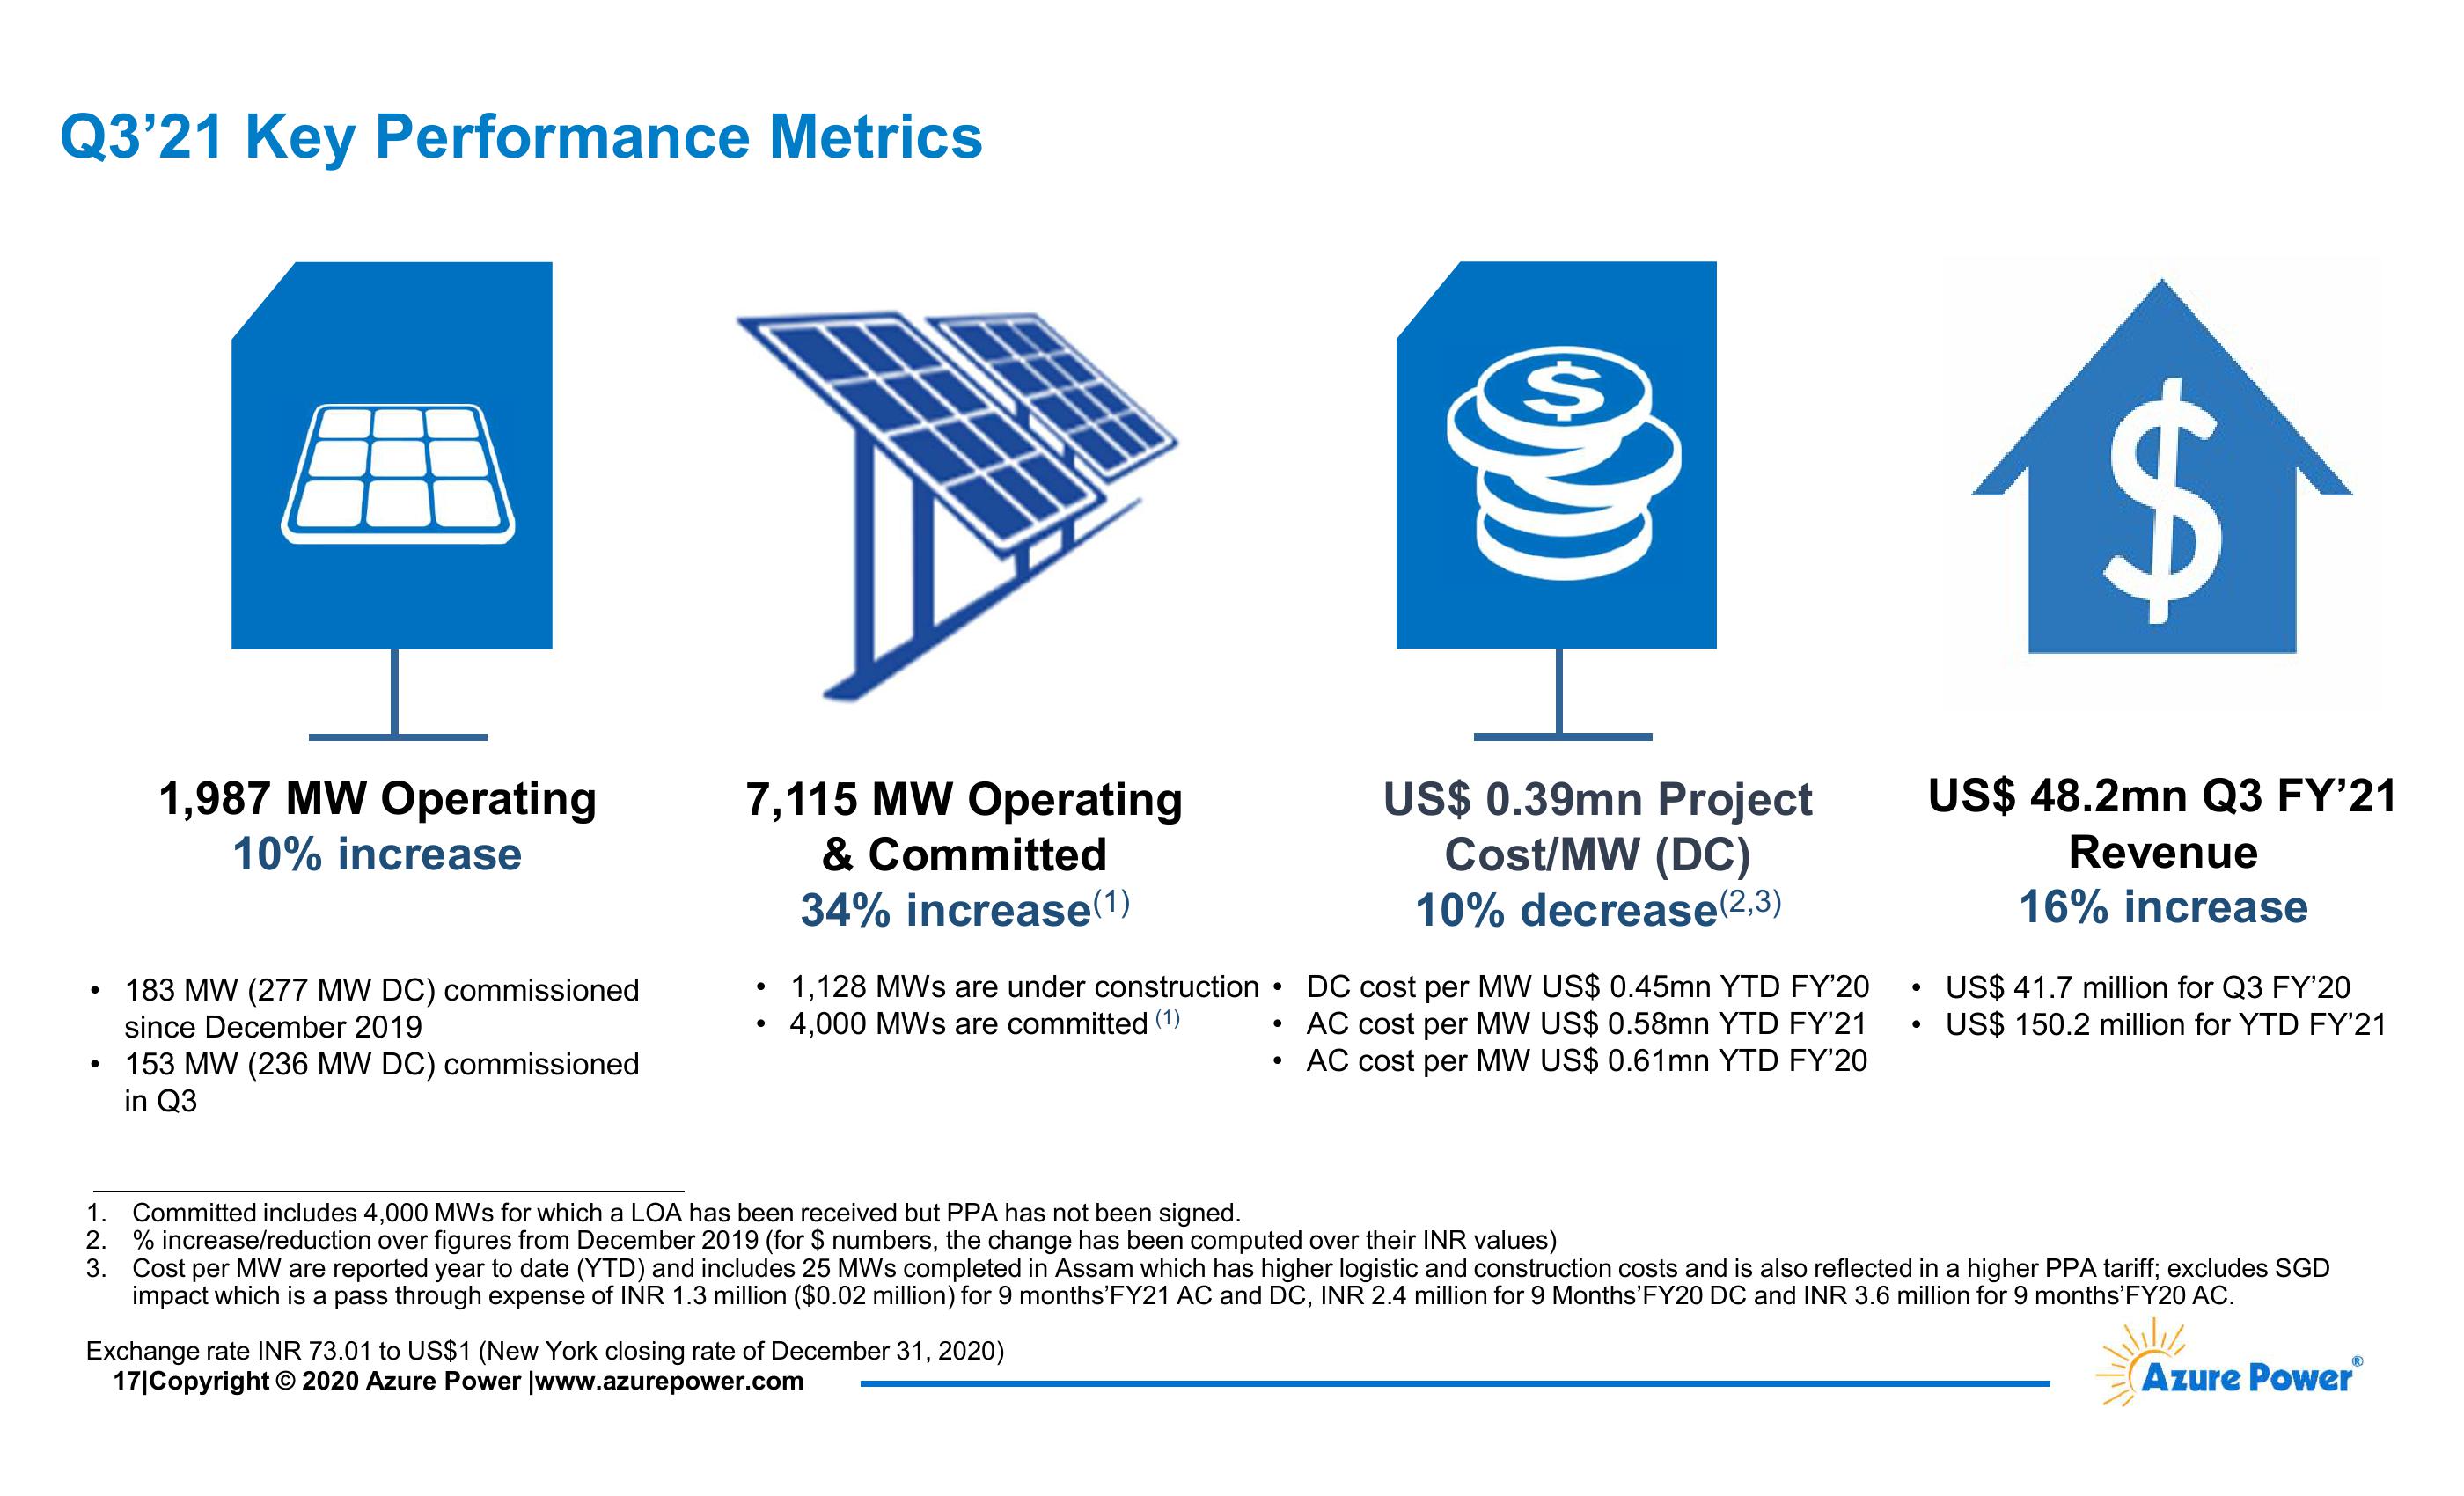
1,987 MW Operating
10% increase
7,115 MW Operating
& Committed
34% increase (1)
1,128 MWs are under construction
US$ 0.39mn Project
Cost/MW (DC)
10% decrease (2,3)
US$ 48.2mn Q3 FY'21
Revenue
16% increase
US$ 41.7 million for Q3 FY'20
•
183 MW (277 MW DC) commissioned
DC cost per MW US$ 0.45mn YTD FY'20
.
since December 2019
•
4,000 MWs are committed (1)
•
AC cost per MW US$ 0.58mn YTD FY'21
•
US$ 150.2 million for YTD FY'21
•
153 MW (236 MW DC) commissioned
in Q3
•
AC cost per MW US$ 0.61mn YTD FY'20
1. Committed includes 4,000 MWs for which a LOA has been received but PPA has not been signed.
2. % increase/reduction over figures from December 2019 (for $ numbers, the change has been computed over their INR values)
3. Cost per MW are reported year to date (YTD) and includes 25 MWs completed in Assam which has higher logistic and construction costs and is also reflected in a higher PPA tariff; excludes SGD
impact which is a pass through expense of INR 1.3 million ($0.02 million) for 9 months'FY21 AC and DC, INR 2.4 million for 9 Months' FY20 DC and INR 3.6 million for 9 months' FY20 AC.
Exchange rate INR 73.01 to US$1 (New York closing rate of December 31, 2020)
17|Copyright © 2020 Azure Power |www.azurepower.com
®
Azure PowerⓇView entire presentation