Frontier IPO Presentation Deck
Outperforming Other ULCCS
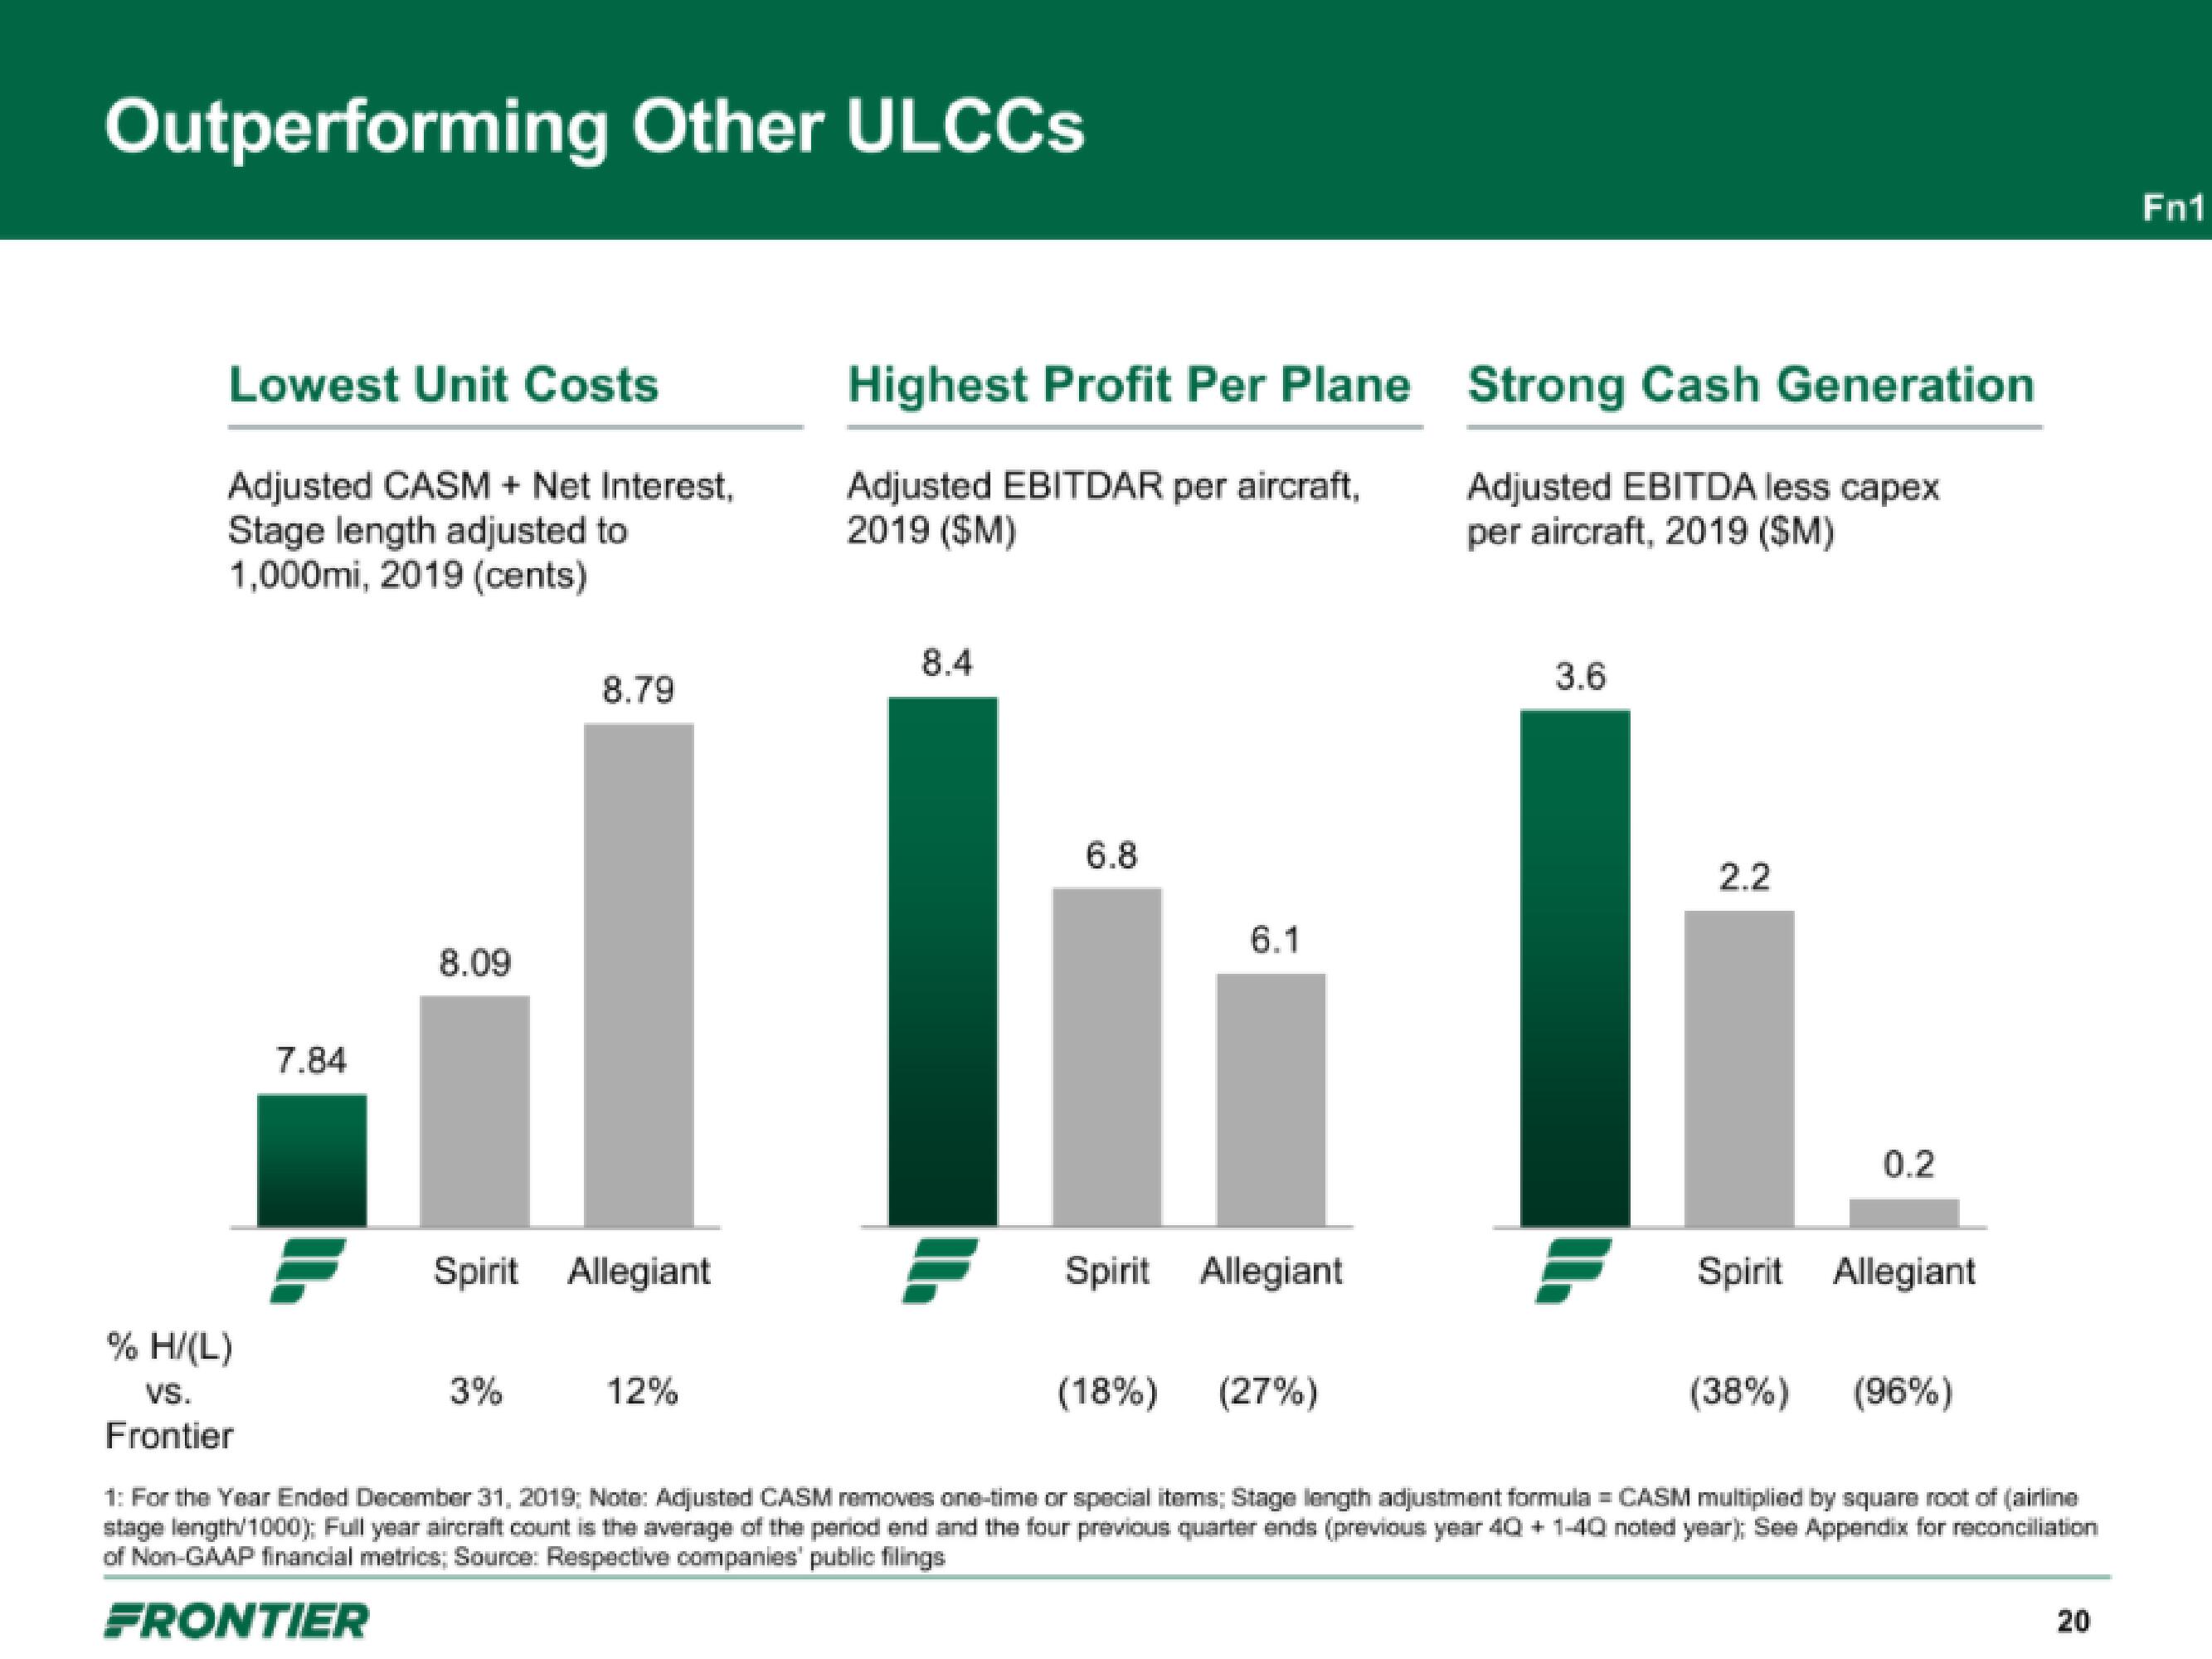
Lowest Unit Costs
Adjusted CASM + Net Interest,
Stage length adjusted to
1,000mi, 2019 (cents)
% H/(L)
VS.
Frontier
7.84
8.09
8.79
Spirit Allegiant
3%
12%
Highest Profit Per Plane
Adjusted EBITDAR per aircraft,
2019 (SM)
8.4
6.8
6.1
Spirit Allegiant
(18%)
(27%)
Strong Cash Generation
Adjusted EBITDA less capex
per aircraft, 2019 (SM)
3.6
2.2
0.2
Spirit Allegiant
(38%) (96%)
1: For the Year Ended December 31, 2019; Note: Adjusted CASM removes one-time or special items; Stage length adjustment formula = CASM multiplied by square root of (airline
stage length/1000); Full year aircraft count is the average of the period end and the four previous quarter ends (previous year 40 + 1-40 noted year); See Appendix for reconciliation
of Non-GAAP financial metrics; Source: Respective companies' public filings
FRONTIER
20
Fn1View entire presentation