Bed Bath & Beyond Results Presentation Deck
Q4 BUSINESS & FINANCIAL RESULTS
positive free cash flow and strong cash position
Solid Free Cash Flow in Q4:
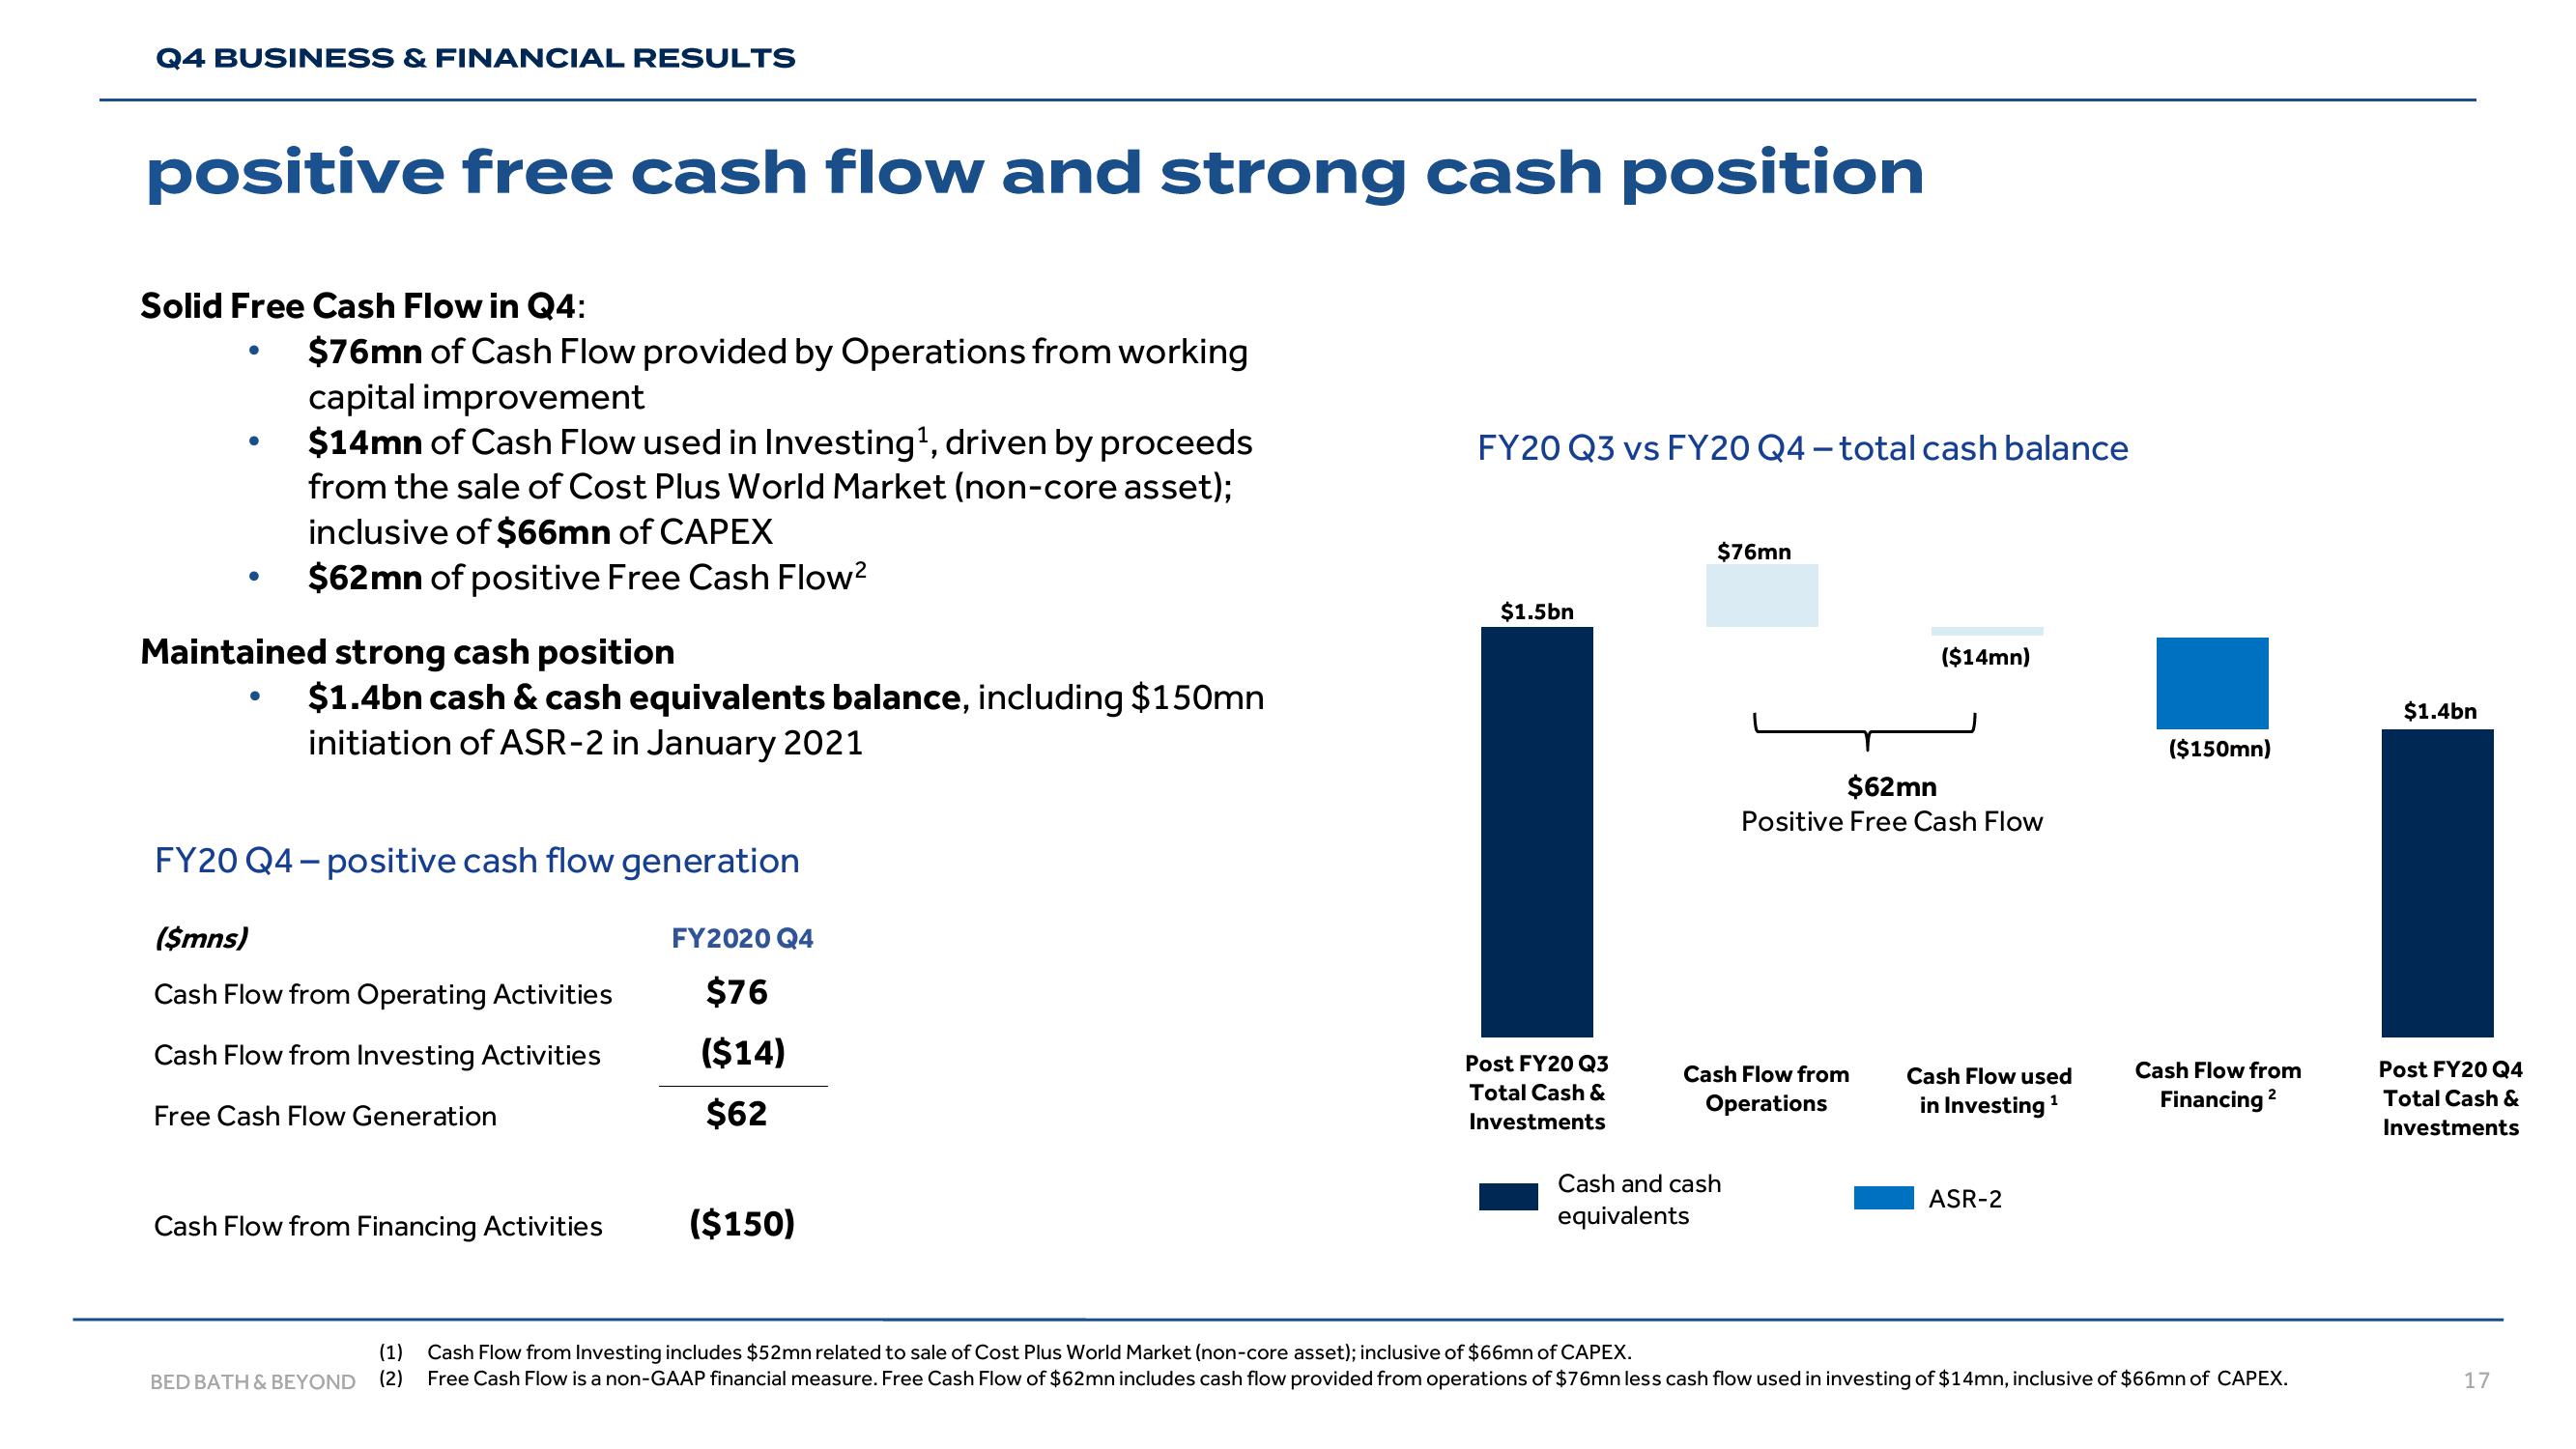
$76mn of Cash Flow provided by Operations from working
capital improvement
$14mn of Cash Flow used in Investing¹, driven by proceeds
from the sale of Cost Plus World Market (non-core asset);
inclusive of $66mn of CAPEX
$62mn of positive Free Cash Flow²
Maintained strong cash position
$1.4bn cash & cash equivalents balance, including $150mn
initiation of ASR-2 in January 2021
FY20 Q4-positive cash flow generation
($mns)
Cash Flow from Operating Activities
Cash Flow from Investing Activities
Free Cash Flow Generation
Cash Flow from Financing Activities
(1)
BED BATH & BEYOND (2)
FY2020 Q4
$76
($14)
$62
($150)
FY20 Q3 vs FY20 Q4 - total cash balance
$1.5bn
Post FY20 Q3
Total Cash &
Investments
$76mn
Cash Flow from
Operations
Cash and cash
equivalents
($14mn)
$62mn
Positive Free Cash Flow
Cash Flow used
in Investing ¹
1
ASR-2
($150mn)
Cash Flow from
Financing ²
2
Cash Flow from Investing includes $52mn related to sale of Cost Plus World Market (non-core asset); inclusive of $66mn of CAPEX.
Free Cash Flow is a non-GAAP financial measure. Free Cash Flow of $62mn includes cash flow provided from operations of $76mn less cash flow used in investing of $14mn, inclusive of $66mn of CAPEX.
$1.4bn
Post FY20 Q4
Total Cash &
Investments
17View entire presentation