AvePoint Investor Presentation Deck
Energy &
Utilities
Life Sciences &
Pharma
Information
Technology
Retail
Healthcare
5%
Education
4%
4%
6%
Construction &
Engineering
Industries
4%
7%
3%
Balanced ARR Contribution
State & Local
Government
8%
9%
Others
10%
15%
Professional &
Administrative Services
14%
11%
Manufacturing &
Production
Finance &
Insurance
Federal
Government
23 ©AvePoint, Inc. All rights reserved. Proprietary information of AvePoint, Inc.
Geography
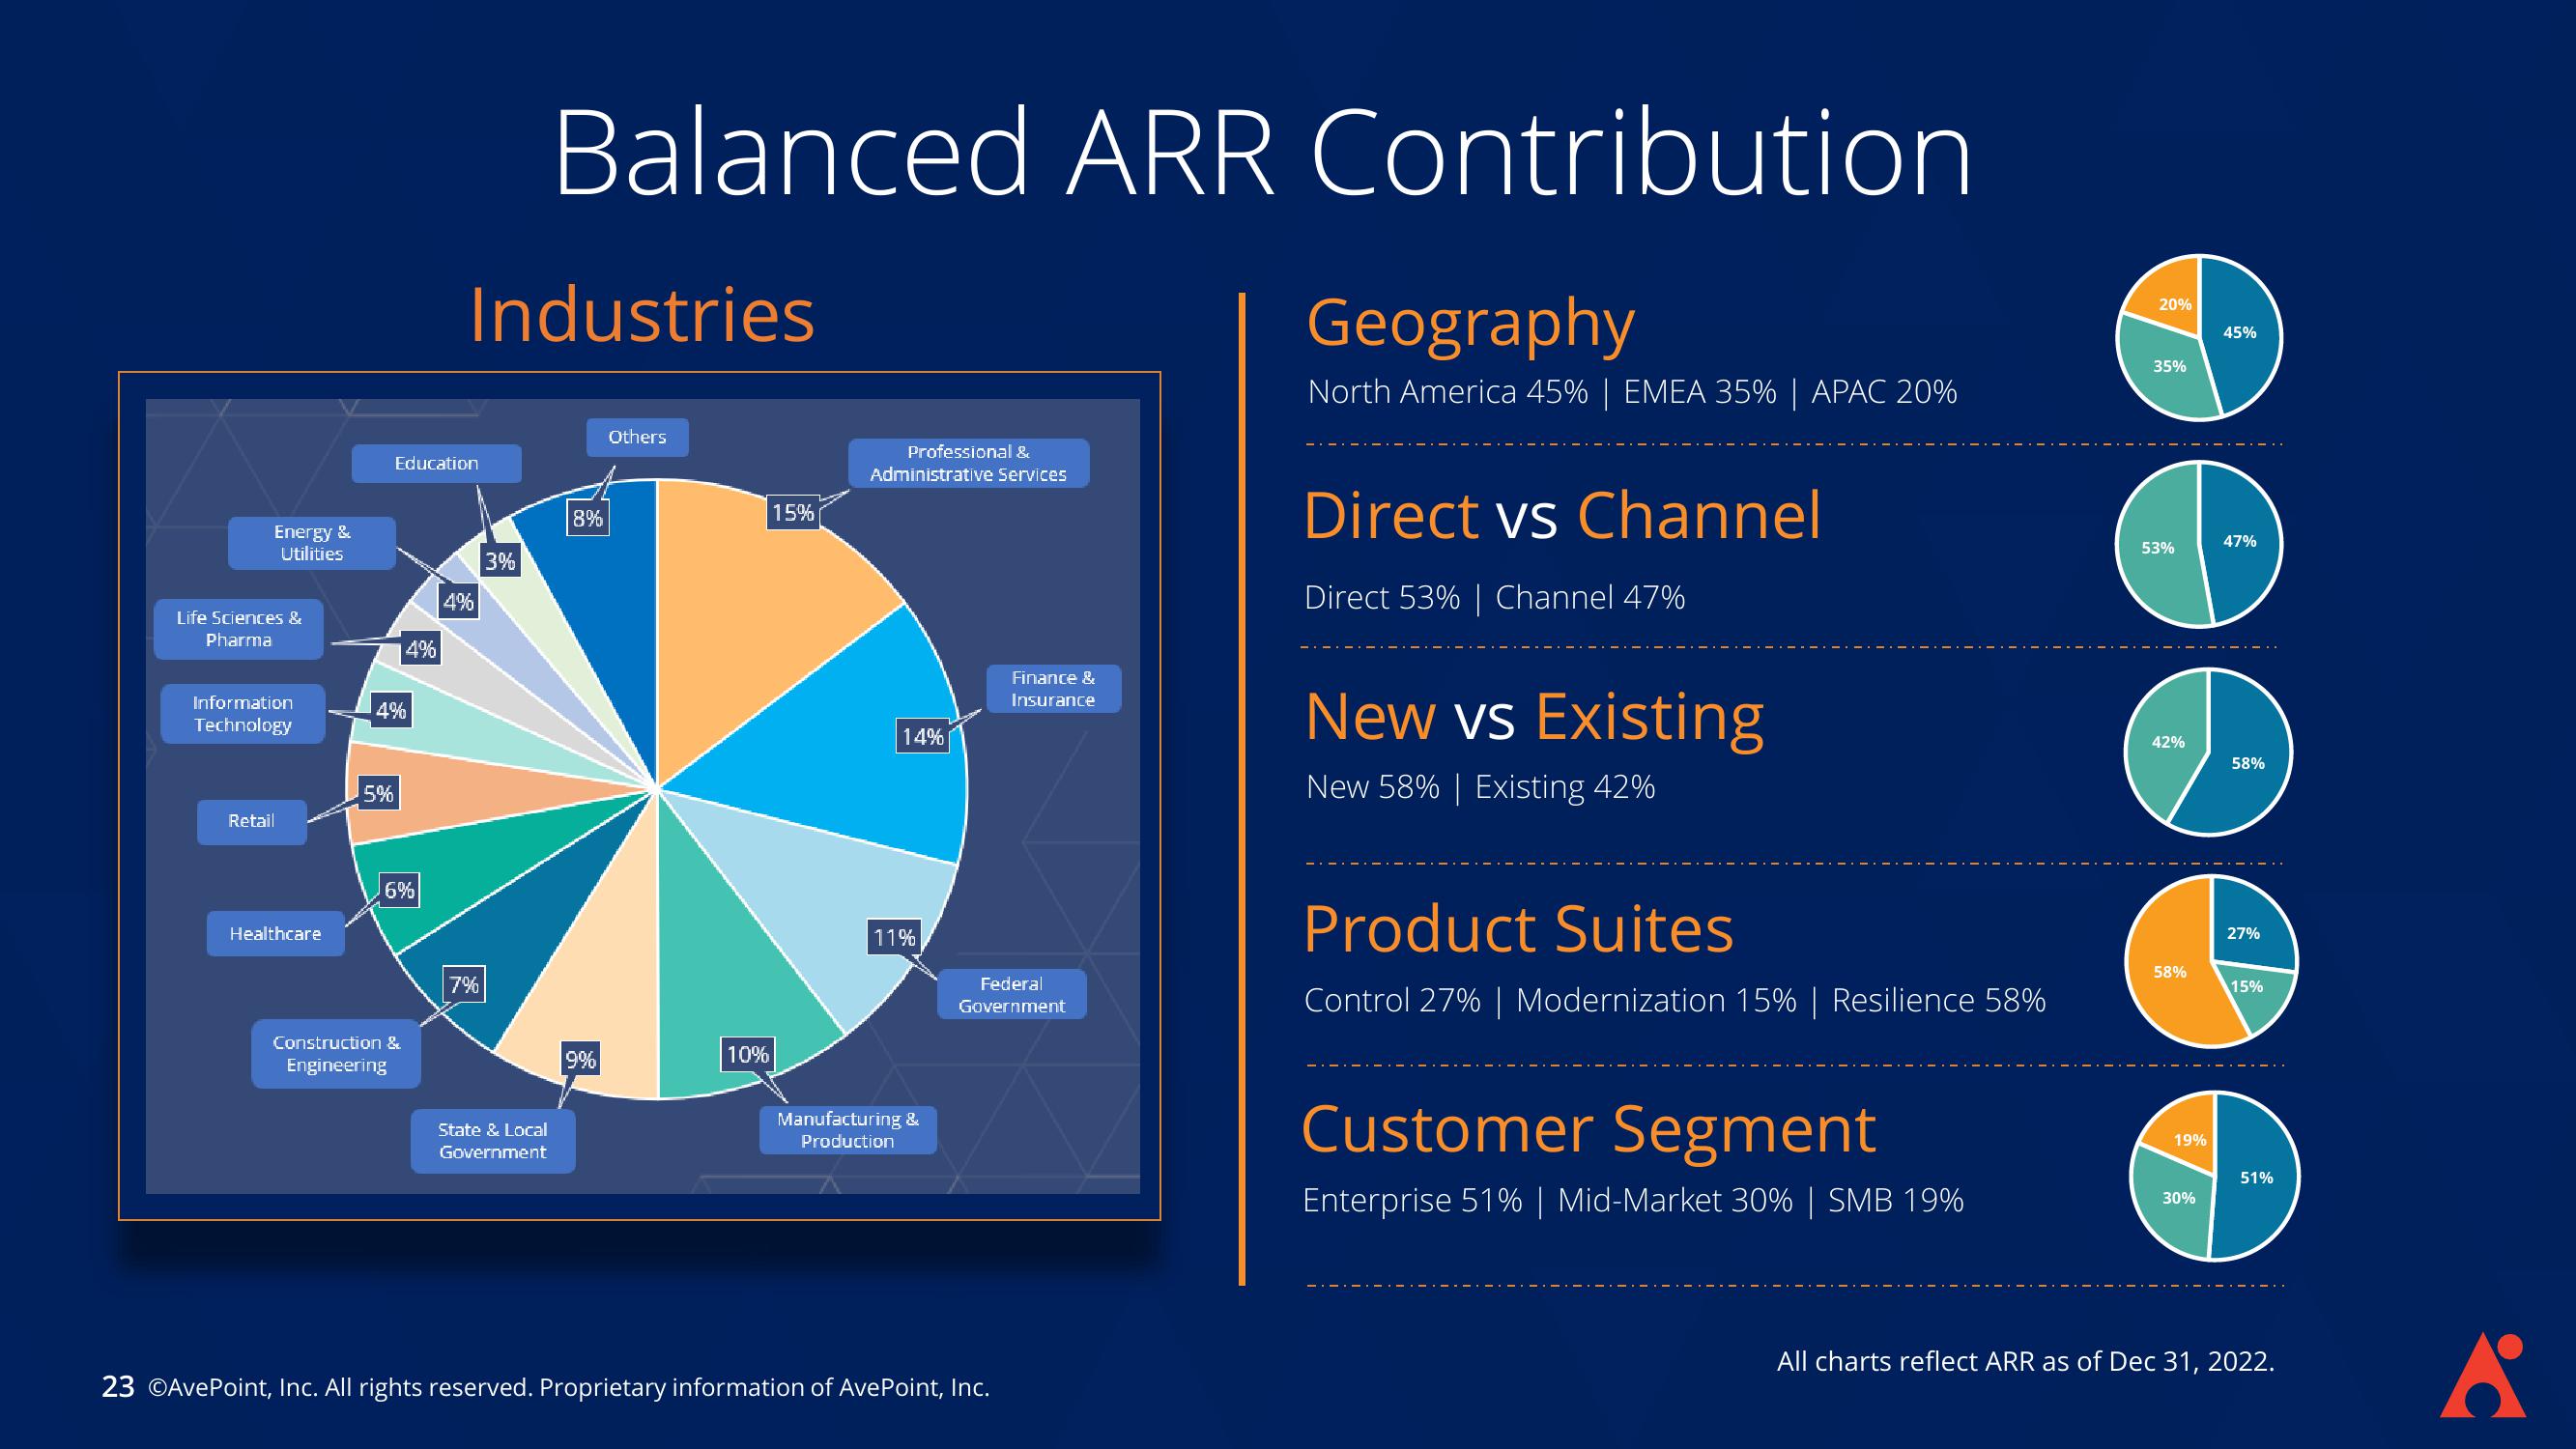
North America 45% | EMEA 35% | APAC 20%
Direct vs Channel
Direct 53% | Channel 47%
New vs Existing
New 58% | Existing 42%
Product Suites
Control 27% | Modernization 15% | Resilience 58%
Customer Segment
Enterprise 51% | Mid-Market 30% | SMB 19%
20%
35%
53%
42%
58%
19%
30%
45%
47%
58%
27%
15%
51%
All charts reflect ARR as of Dec 31, 2022.View entire presentation