First Busey Results Presentation Deck
4Q23 Earnings Investor Presentation
Net Interest Margin
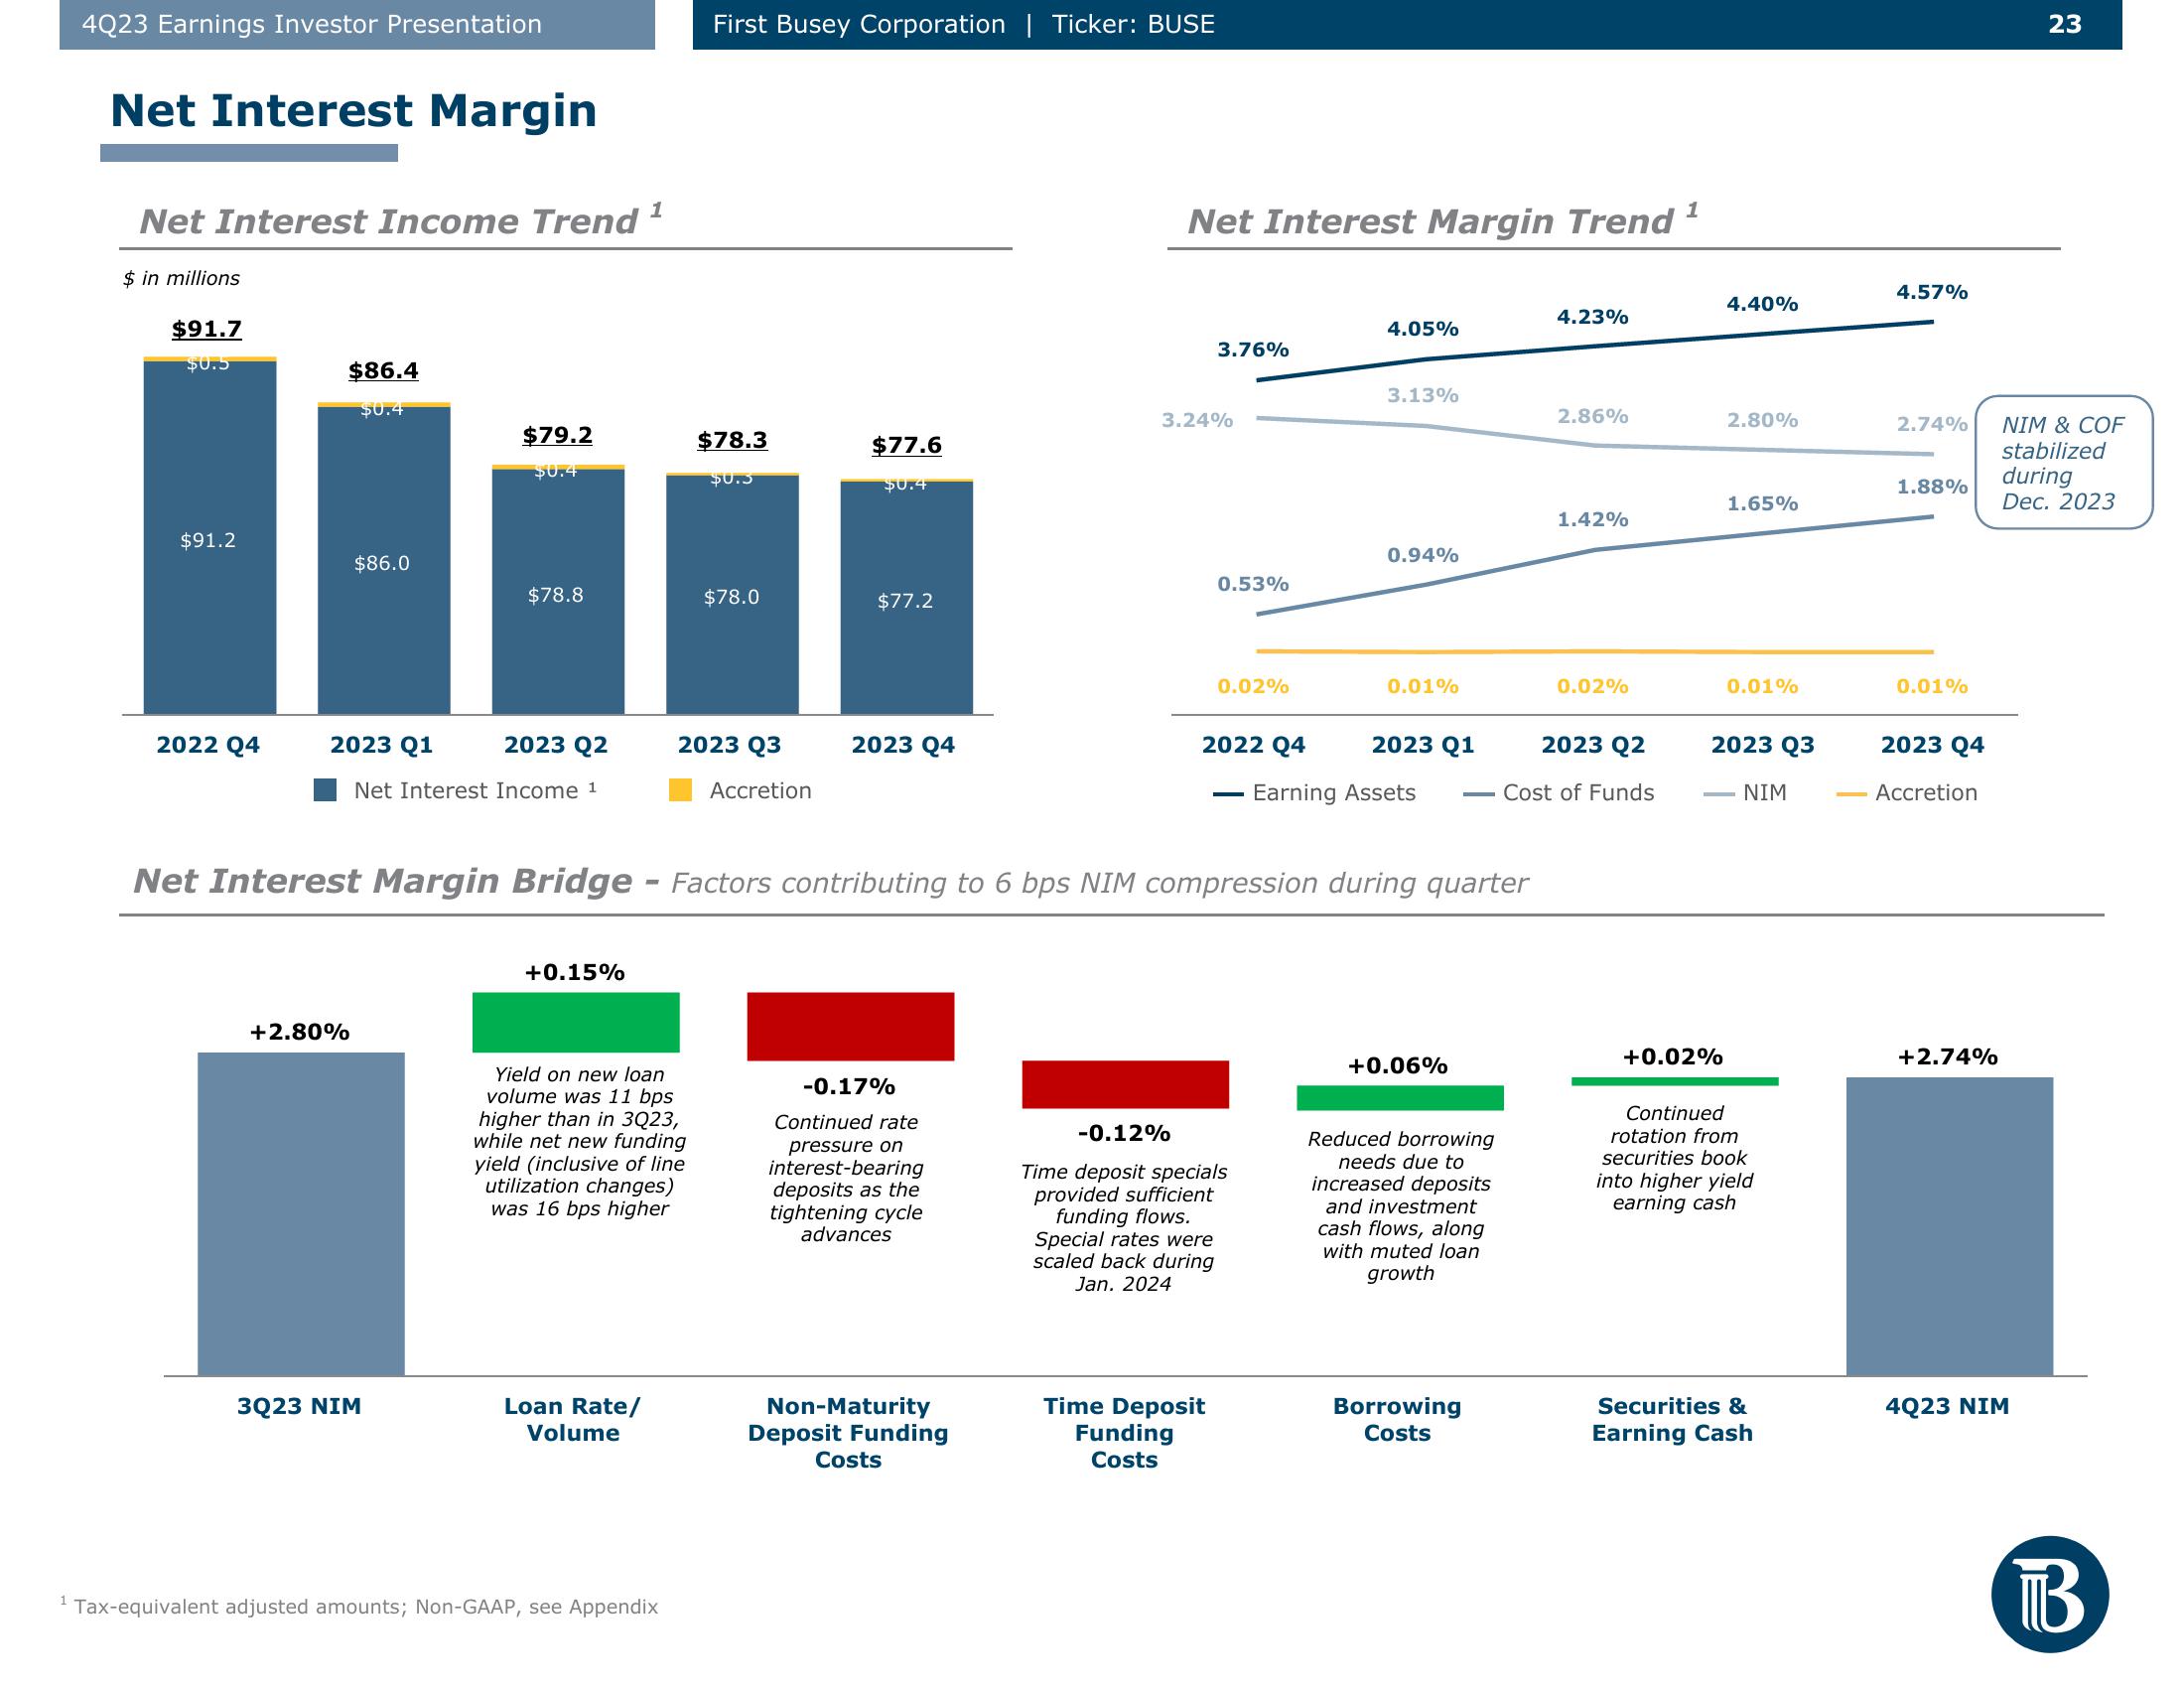
Net Interest Income Trend ¹
$ in millions
$91.7
$0.5
$91.2
2022 Q4
$86.4
$0.4
$86.0
2023 Q1
+2.80%
$79.2
$0.4
2023 Q2
Net Interest Income 1
$78.8
3Q23 NIM
+0.15%
Yield on new loan
volume was 11 bps
higher than in 3Q23,
while net new funding
yield (inclusive of line
utilization changes)
was 16 bps higher
Loan Rate/
Volume
First Busey Corporation | Ticker: BUSE
Tax-equivalent adjusted amounts; Non-GAAP, see Appendix
$78.3
$0.3
$78.0
2023 Q3
Accretion
$77.6
$0.4
$77.2
2023 Q4
-0.17%
Continued rate
pressure on
interest-bearing
deposits as the
tightening cycle
advances
Non-Maturity
Deposit Funding
Costs
Net Interest Margin Trend
3.76%
3.24%
Net Interest Margin Bridge - Factors contributing to 6 bps NIM compression during quarter
0.53%
0.02%
Time Deposit
Funding
Costs
4.05%
-0.12%
Time deposit specials
provided sufficient
funding flows.
Special rates were
scaled back during
Jan. 2024
3.13%
0.94%
2022 Q4 2023 Q1
Earning Assets
0.01%
+0.06%
Reduced borrowing
needs due to
increased deposits
and investment
cash flows, along
with muted loan
growth
Borrowing
Costs
4.23%
2.86%
1.42%
0.02%
2023 Q2
Cost of Funds
1
4.40%
+0.02%
2.80%
1.65%
0.01%
2023 Q3
NIM
Continued
rotation from
securities book
into higher yield
earning cash
Securities &
Earning Cash
4.57%
2.74%
1.88%
0.01%
2023 Q4
Accretion
+2.74%
23
NIM & COF
stabilized
during
Dec. 2023
4Q23 NIM
BView entire presentation