Bank of America Investment Banking Pitch Book
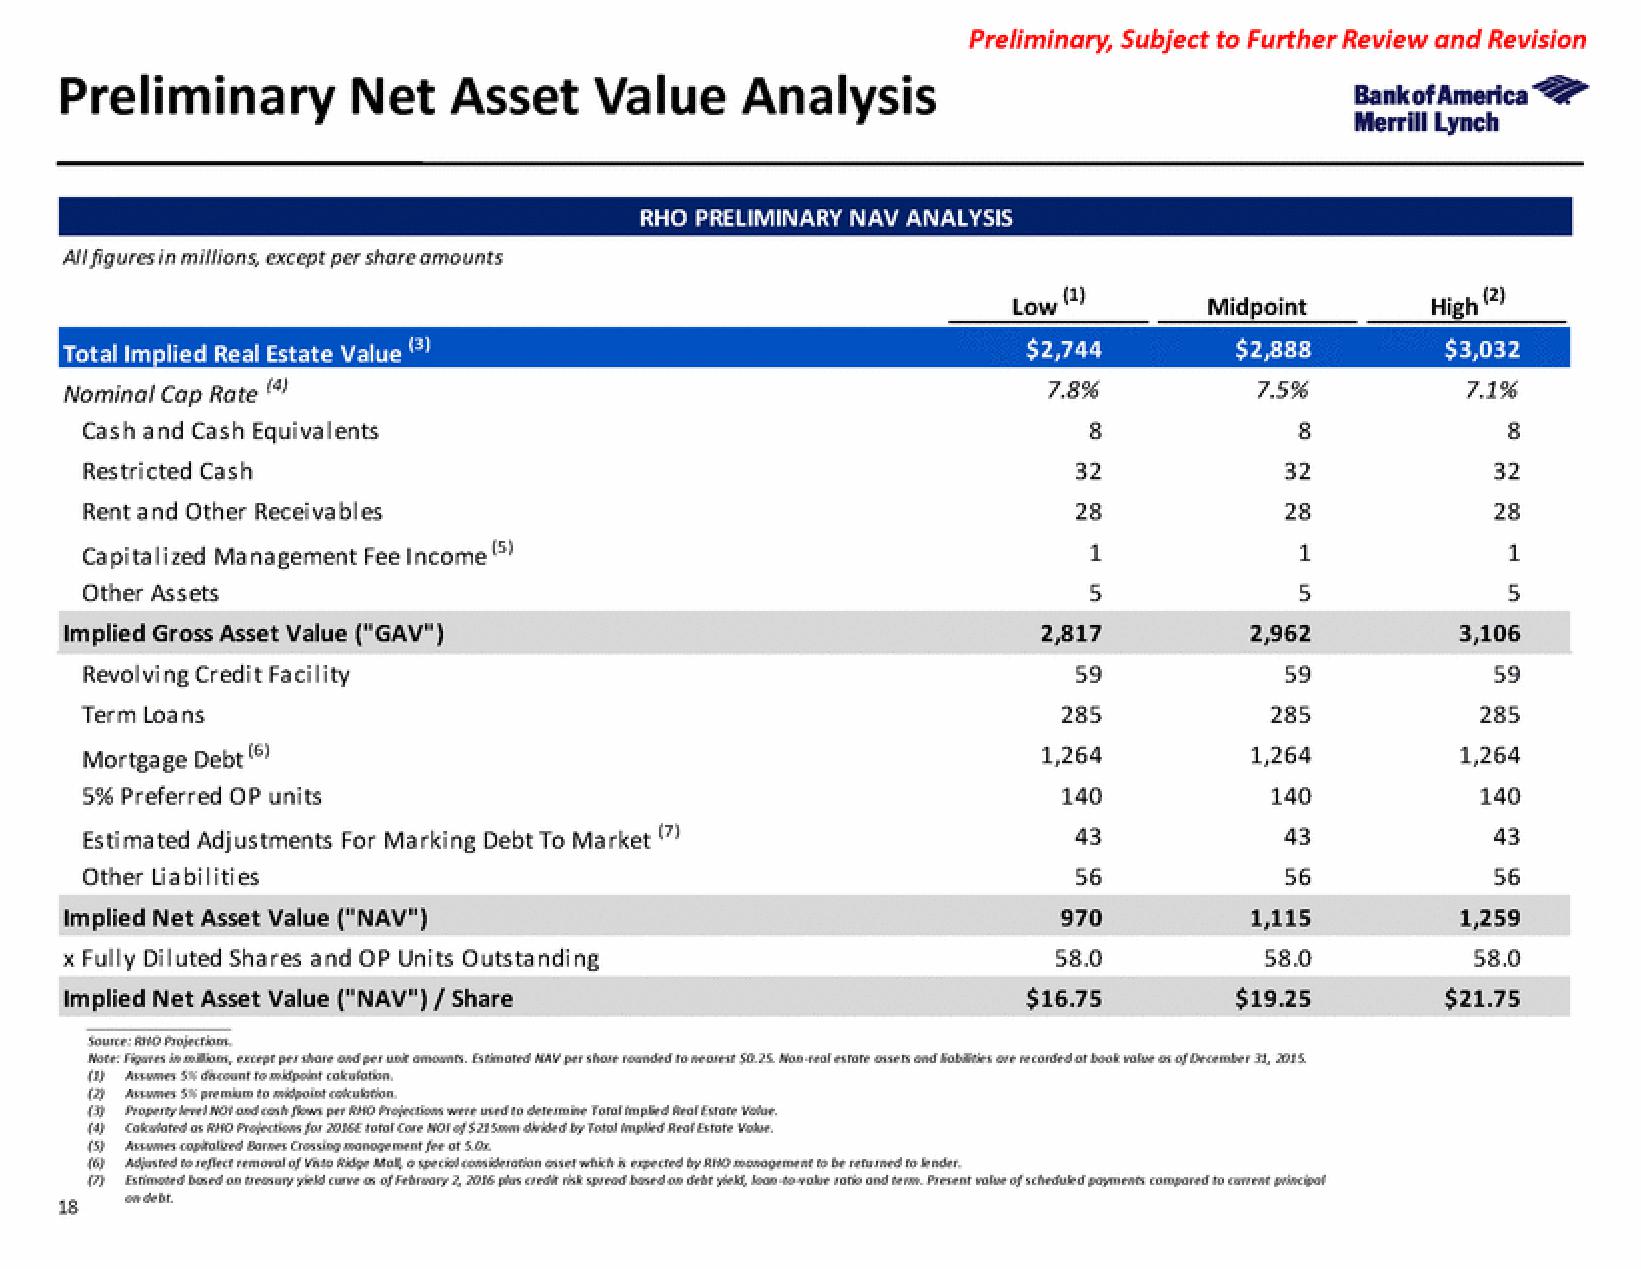
Preliminary Net Asset Value Analysis
All figures in millions, except per share amounts
Total Implied Real Estate Value
Nominal Cap Rate
Cash and Cash Equivalents
Restricted Cash
Rent and Other Receivables
Capitalized Management Fee Income (5)
Other Assets
Implied Gross Asset Value ("GAV")
Revolving Credit Facility
Term Loans
18
(6)
Mortgage Debt
5% Preferred OP units
Estimated Adjustments For Marking Debt To Market
Other Liabilities.
Implied Net Asset Value ("NAV")
x Fully Diluted Shares and OP Units Outstanding
Implied Net Asset Value ("NAV") / Share
(5)
(6)
(7)
RHO PRELIMINARY NAV ANALYSIS
Preliminary, Subject to Further Review and Revision
Bank of America
Merrill Lynch
(7)
(1)
Low
$2,744
7.8%
8
32
28
1
5
2,817
59
285
1,264
140
43
56
970
58.0
$16.75
Midpoint
$2,888
7.5%
8
32
28
1
5
2,962
59
285
1,264
140
43
56
1,115
58.0
$19.25
Source: RIO Projections
Note: Figures in million, except per share and per unit amounts. Estimated NAV per shore rounded to nearest 50.25. Non-real estate ossets and liabilities are recorded of book value os of December 31, 2015
Assumes 5% discount to midpoint calculation.
(2) Assumes 5% premium to midpoint calculation.
(3)
Property level NOT and cash flows per RHO Projections were used to determine Total implied Real Estate Volur.
Calculated as RHO Projections for 2016E total Care NOT of $215mm divided by Total Implied Real Estate Volur.
Assumes capitalized Barnes Crossing management fee of 5.0x
Adjusted to reflect removal of Visto Ridge Mallo special consideration asset which is expected by Rito management to be returned to lender.
Estimated based on treasury yield curve as of February 2, 2016 plas credit risk spread based on debt yield, lean-to-value ratio and tem. Present value of scheduled payments compared to corrent principal
on debt.
High
(2)
$3,032
7.1%
8
32
28
1
5
3,106
59
285
1,264
140
43
56
1,259
58.0
$21.75View entire presentation