Markforged Results Presentation Deck
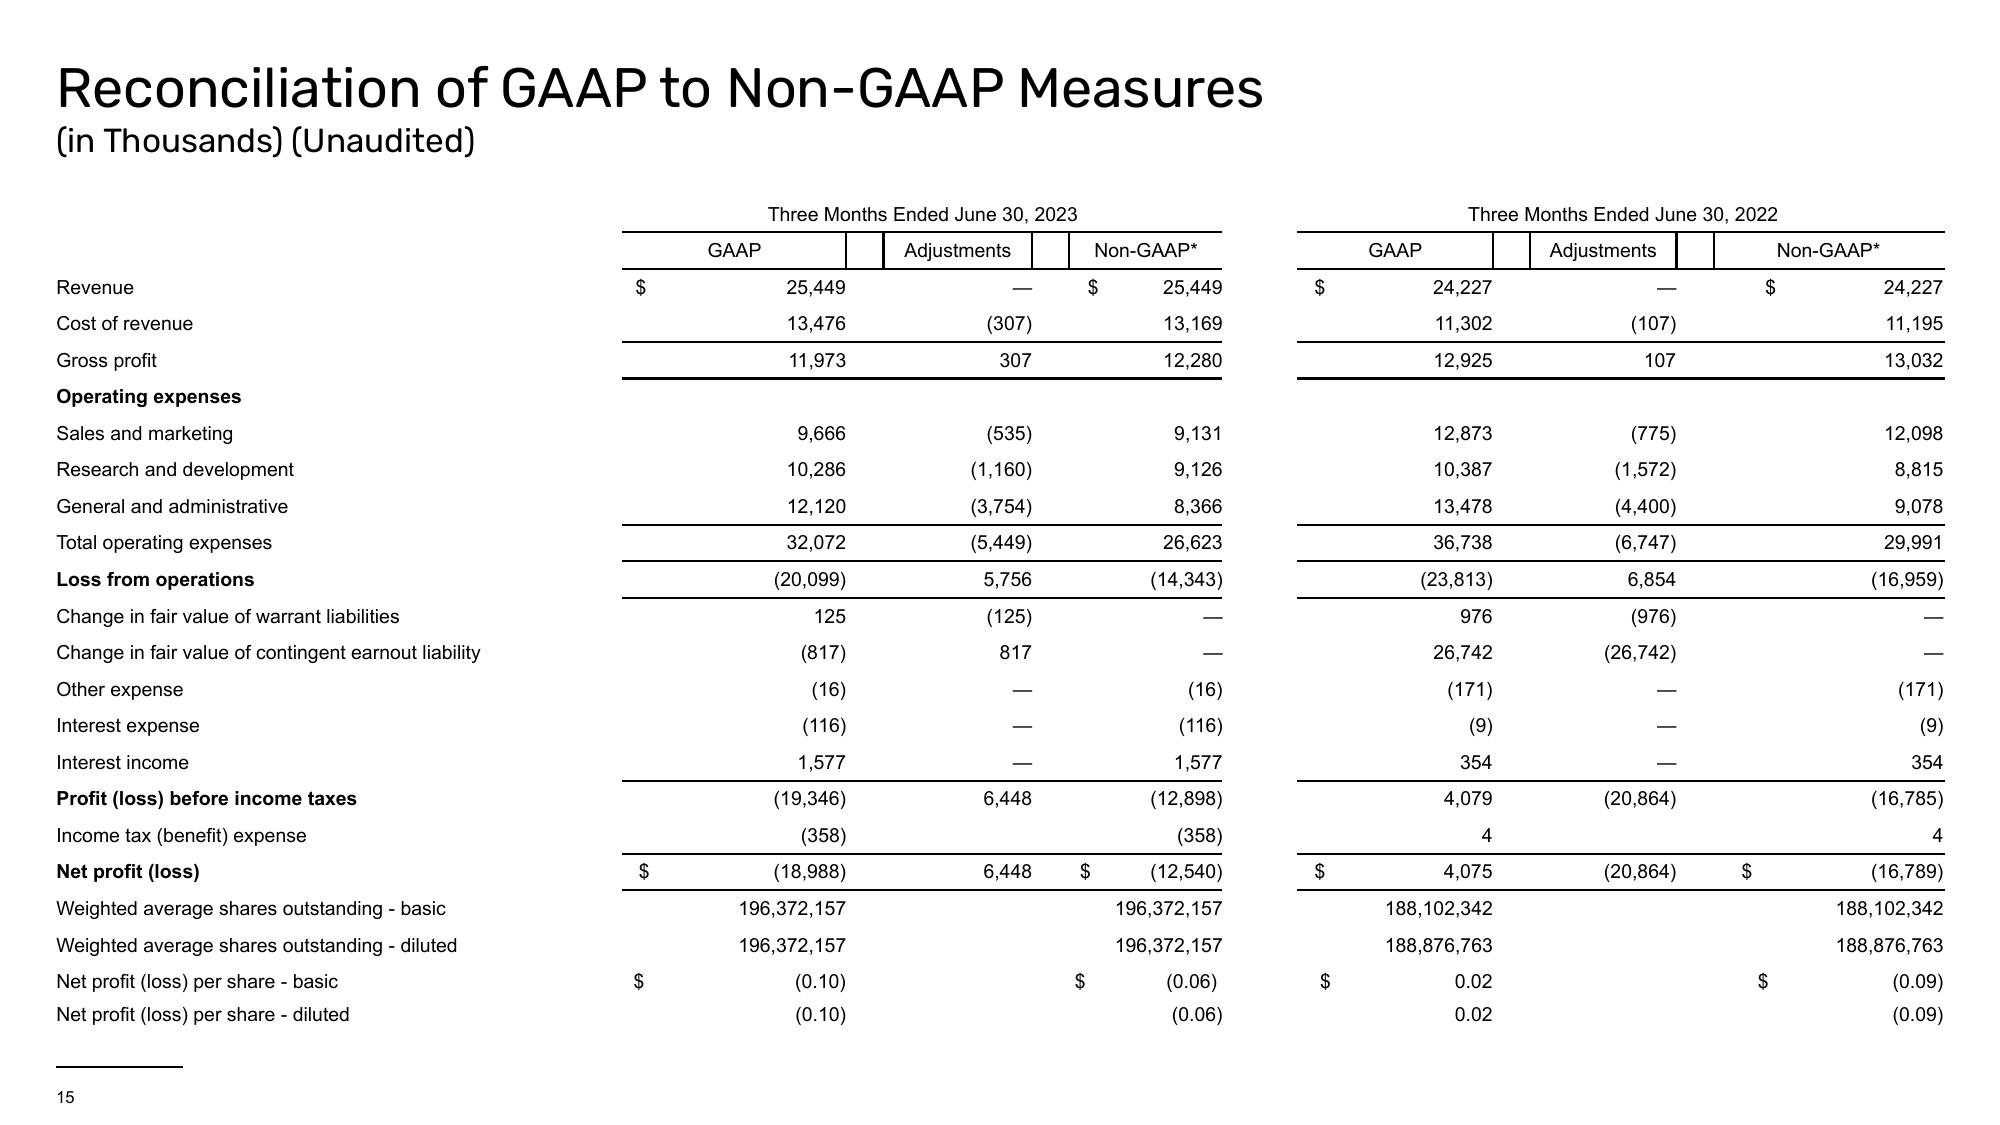
Reconciliation of GAAP to Non-GAAP Measures
(in Thousands) (Unaudited)
Revenue
Cost of revenue
Gross profit
Operating expenses
Sales and marketing
Research and development
General and administrative
Total operating expenses
Loss from operations
Change in fair value of warrant liabilities
Change in fair value of contingent earnout liability
Other expense
Interest expense
Interest income
Profit (loss) before income taxes
Income tax (benefit) expense
Net profit (loss)
Weighted average shares outstanding - basic
Weighted average shares outstanding - diluted
Net profit (loss) per share - basic
Net profit (loss) per share - diluted
15
$
$
$
GAAP
Three Months Ended June 30, 2023
Adjustments
25,449
13,476
11,973
9,666
10,286
12,120
32,072
(20,099)
125
(817)
(16)
(116)
1,577
(19,346)
(358)
(18,988)
196,372,157
196,372,157
(0.10)
(0.10)
(307)
307
(535)
(1,160)
(3,754)
(5,449)
5,756
(125)
817
6,448
6,448
$
$
Non-GAAP*
$
25,449
13,169
12,280
9,131
9,126
8,366
26,623
(14,343)
(16)
(116)
1,577
(12,898)
(358)
(12,540)
196,372,157
196,372,157
(0.06)
(0.06)
$
$
$
GAAP
Three Months Ended June 30, 2022
Adjustments
24,227
11,302
12,925
12,873
10,387
13,478
36,738
(23,813)
976
26,742
(171)
(9)
354
4,079
4
4,075
188,102,342
188,876,763
0.02
0.02
(107)
107
(775)
(1,572)
(4,400)
(6,747)
6,854
(976)
(26,742)
(20,864)
(20,864)
$
Non-GAAP*
$
$
24,227
11,195
13,032
12,098
8,815
9,078
29,991
(16,959)
(171)
(9)
354
(16,785)
4
(16,789)
188,102,342
188,876,763
(0.09)
(0.09)View entire presentation