EVE SPAC Presentation Deck
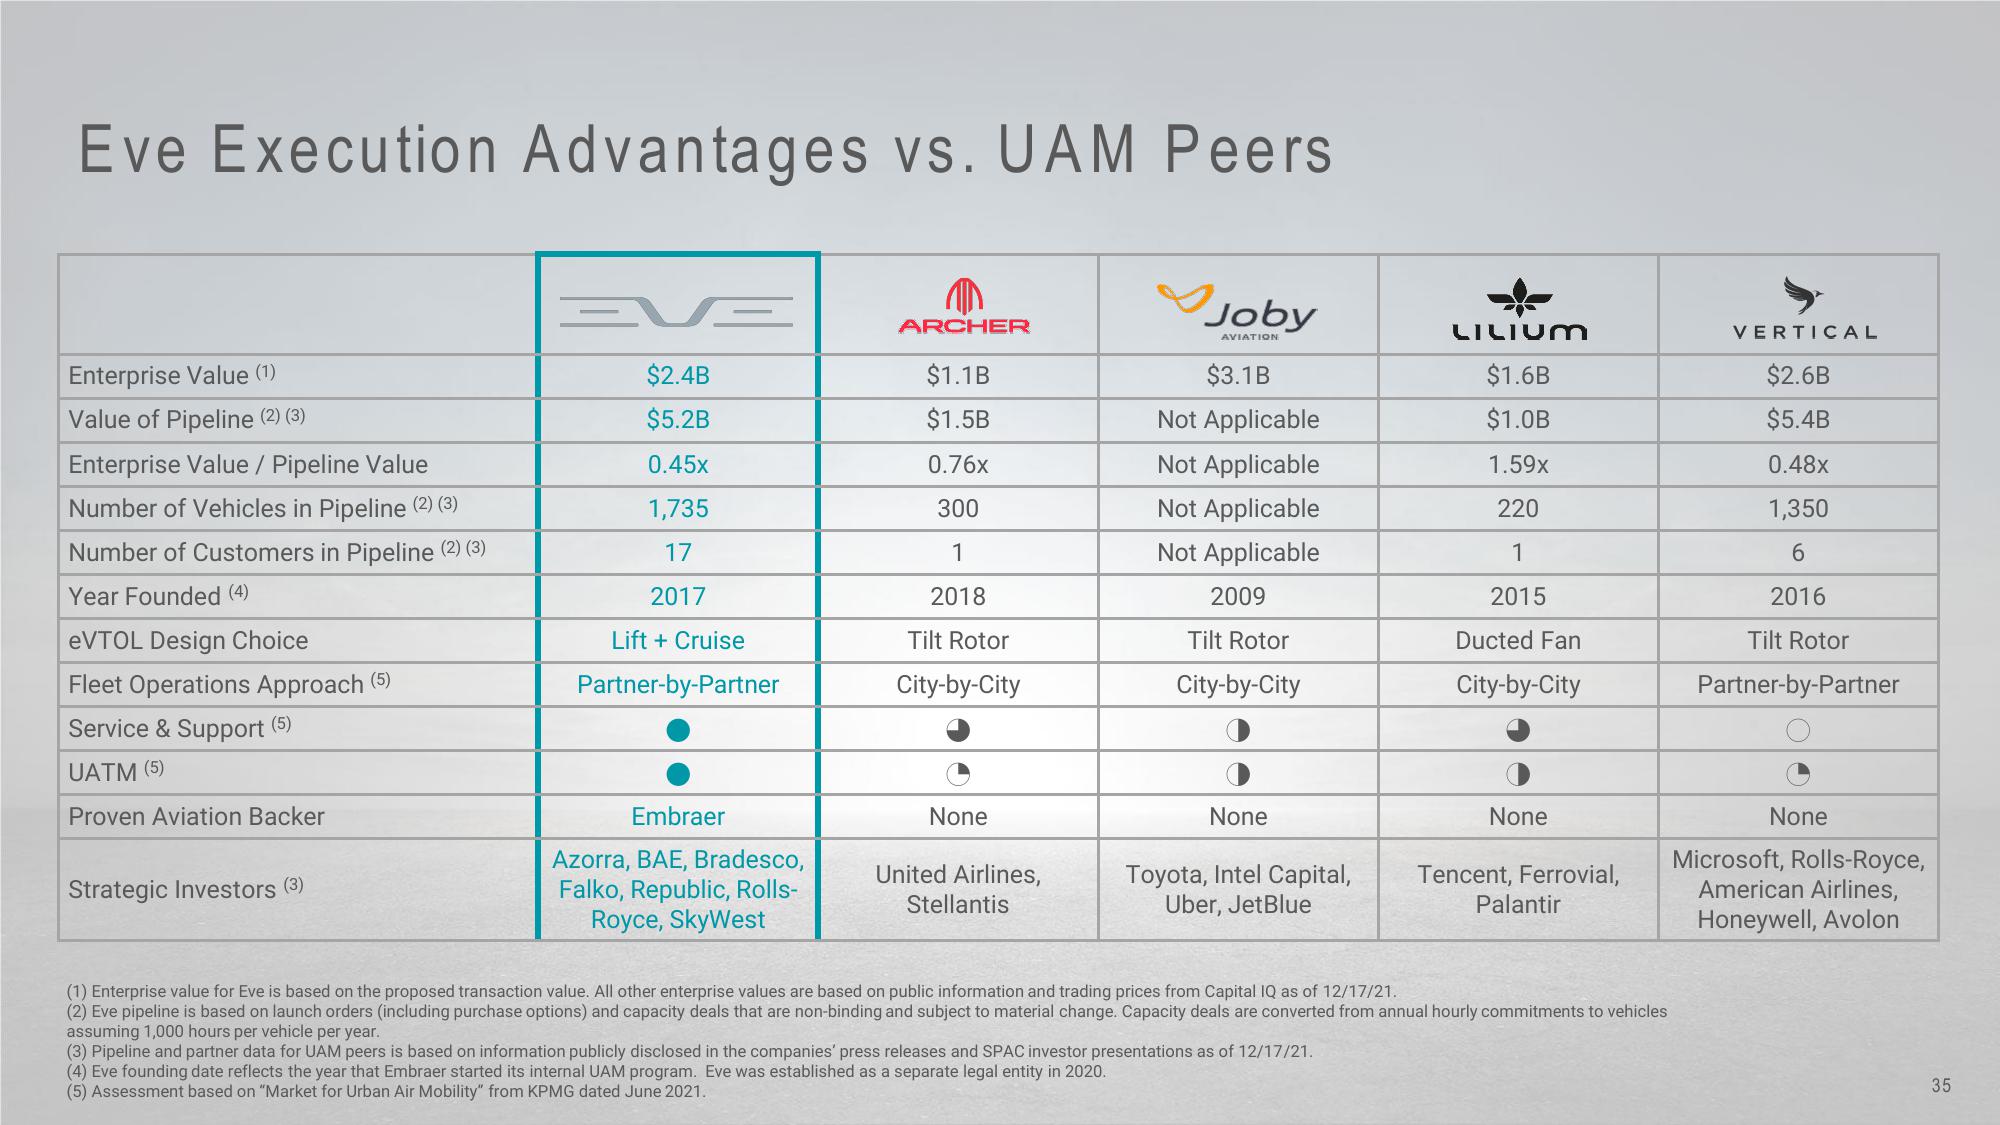
Eve Execution Advantages vs. UAM Peers
Enterprise Value (1)
Value of Pipeline (2) (3)
Enterprise Value / Pipeline Value
Number of Vehicles in Pipeline (2) (3)
Number of Customers in Pipeline (2) (3)
Year Founded (4)
eVTOL Design Choice
Fleet Operations Approach (5)
Service & Support (5)
UATM (5)
Proven Aviation Backer
Strategic Investors (3)
EVE
$2.4B
$5.2B
0.45x
1,735
17
2017
Lift + Cruise
Partner-by-Partner
Embraer
Azorra, BAE, Bradesco,
Falko, Republic, Rolls-
Royce, SkyWest
ARCHER
$1.1B
$1.5B
0.76x
300
1
2018
Tilt Rotor
City-by-City
None
United Airlines,
Stellantis
Joby
AVIATION
$3.1B
Not Applicable
Not Applicable
Not Applicable
Not Applicable
2009
Tilt Rotor
City-by-City
None
Toyota, Intel Capital,
Uber, JetBlue
LILIUM
$1.6B
$1.0B
1.59x
220
1
2015
Ducted Fan
City-by-City
None
Tencent, Ferrovial,
Palantir
(1) Enterprise value for Eve is based on the proposed transaction value. All other enterprise values are based on public information and trading prices from Capital IQ as of 12/17/21.
(2) Eve pipeline is based on launch orders (including purchase options) and capacity deals that are non-binding and subject to material change. Capacity deals are converted from annual hourly commitments to vehicles
assuming 1,000 hours per vehicle per year.
(3) Pipeline and partner data for UAM peers is based on information publicly disclosed in the companies' press releases and SPAC investor presentations as of 12/17/21.
(4) Eve founding date reflects the year that Embraer started its internal UAM program. Eve was established as a separate legal entity in 2020.
(5) Assessment based on "Market for Urban Air Mobility" from KPMG dated June 2021.
VERTICAL
$2.6B
$5.4B
0.48x
1,350
6
2016
Tilt Rotor
Partner-by-Partner
None
Microsoft, Rolls-Royce,
American Airlines,
Honeywell, Avolon
35View entire presentation