Fourth Quarter and Fiscal Year 2023 Financial Results
16
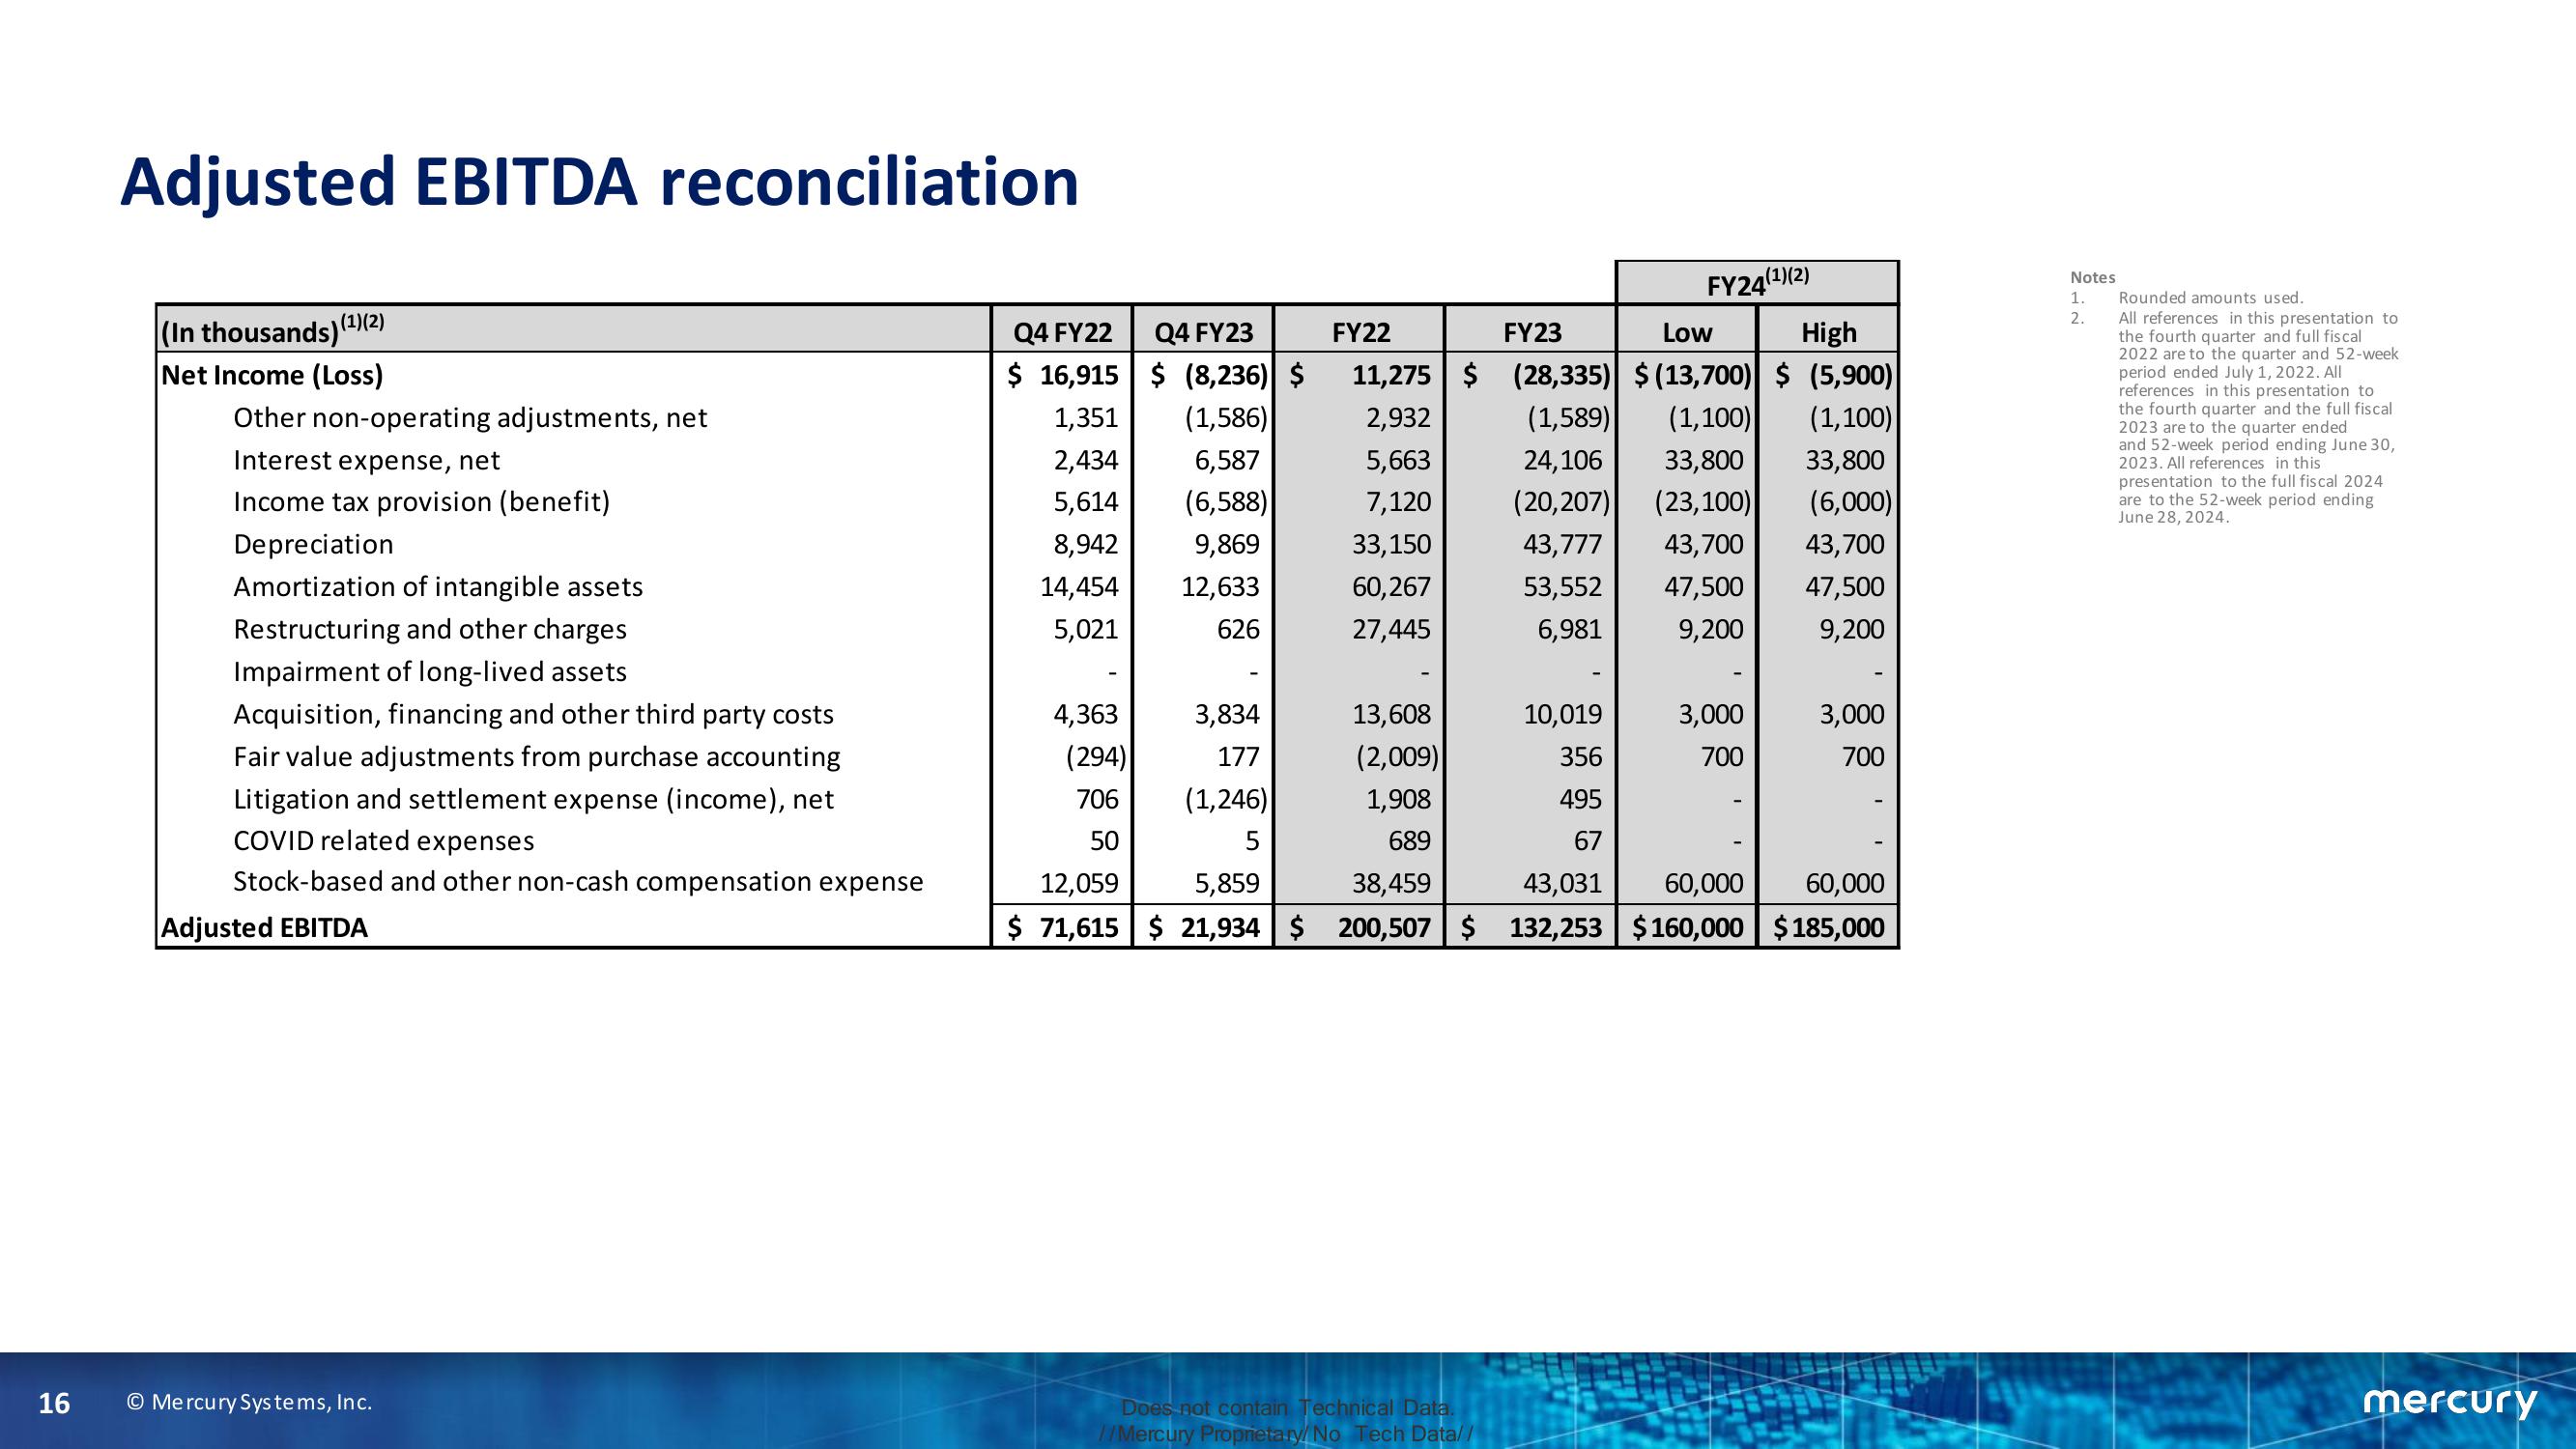
Adjusted EBITDA reconciliation
(In thousands)
(1)(2)
Net Income (Loss)
Other non-operating adjustments, net
Interest expense, net
Income tax provision (benefit)
Depreciation
Amortization of intangible assets
Restructuring and other charges
Impairment of long-lived assets
Acquisition, financing and other third party costs
Fair value adjustments from purchase accounting
Litigation and settlement expense (income), net
COVID related expenses
Stock-based and other non-cash compensation expense
Adjusted EBITDA
© Mercury Systems, Inc.
Q4 FY22
$ 16,915
1,351
2,434
5,614
8,942
14,454
5,021
4,363
Q4 FY23
$ (8,236) $
(1,586)
6,587
(6,588)
9,869
12,633
626
(294)
706
50
3,834
177
(1,246)
5
5,859
12,059
38,459
43,031
60,000
60,000
$ 71,615 $ 21,934 $ 200,507 $ 132,253 $160,000 $185,000
FY24¹
(1)(2)
High
FY22
FY23
Low
11,275 $ (28,335) $(13,700) $ (5,900)
2,932
(1,589) (1,100)
(1,100)
5,663
24,106 33,800
33,800
(20,207) (23,100)
(6,000)
7,120
33,150
60,267
43,777 43,700 43,700
53,552
6,981
47,500 47,500
9,200
27,445
9,200
13,608
(2,009)
1,908
689
Does not contain Technical Data.
//Mercury Proprietary/No Tech Data//
10,019
356
495
67
3,000
700
3,000
700
Notes
1.
2.
Rounded amounts used.
All references in this presentation to
the fourth quarter and full fiscal
2022 are to the quarter and 52-week
period ended July 1, 2022. All
references in this presentation to
the fourth quarter and the full fiscal
2023 are to the quarter ended
and 52-week period ending June 30,
2023. All references in this
presentation to the full fiscal 2024
are to the 52-week period ending
June 28, 2024.
mercuryView entire presentation