BAT Results Presentation Deck
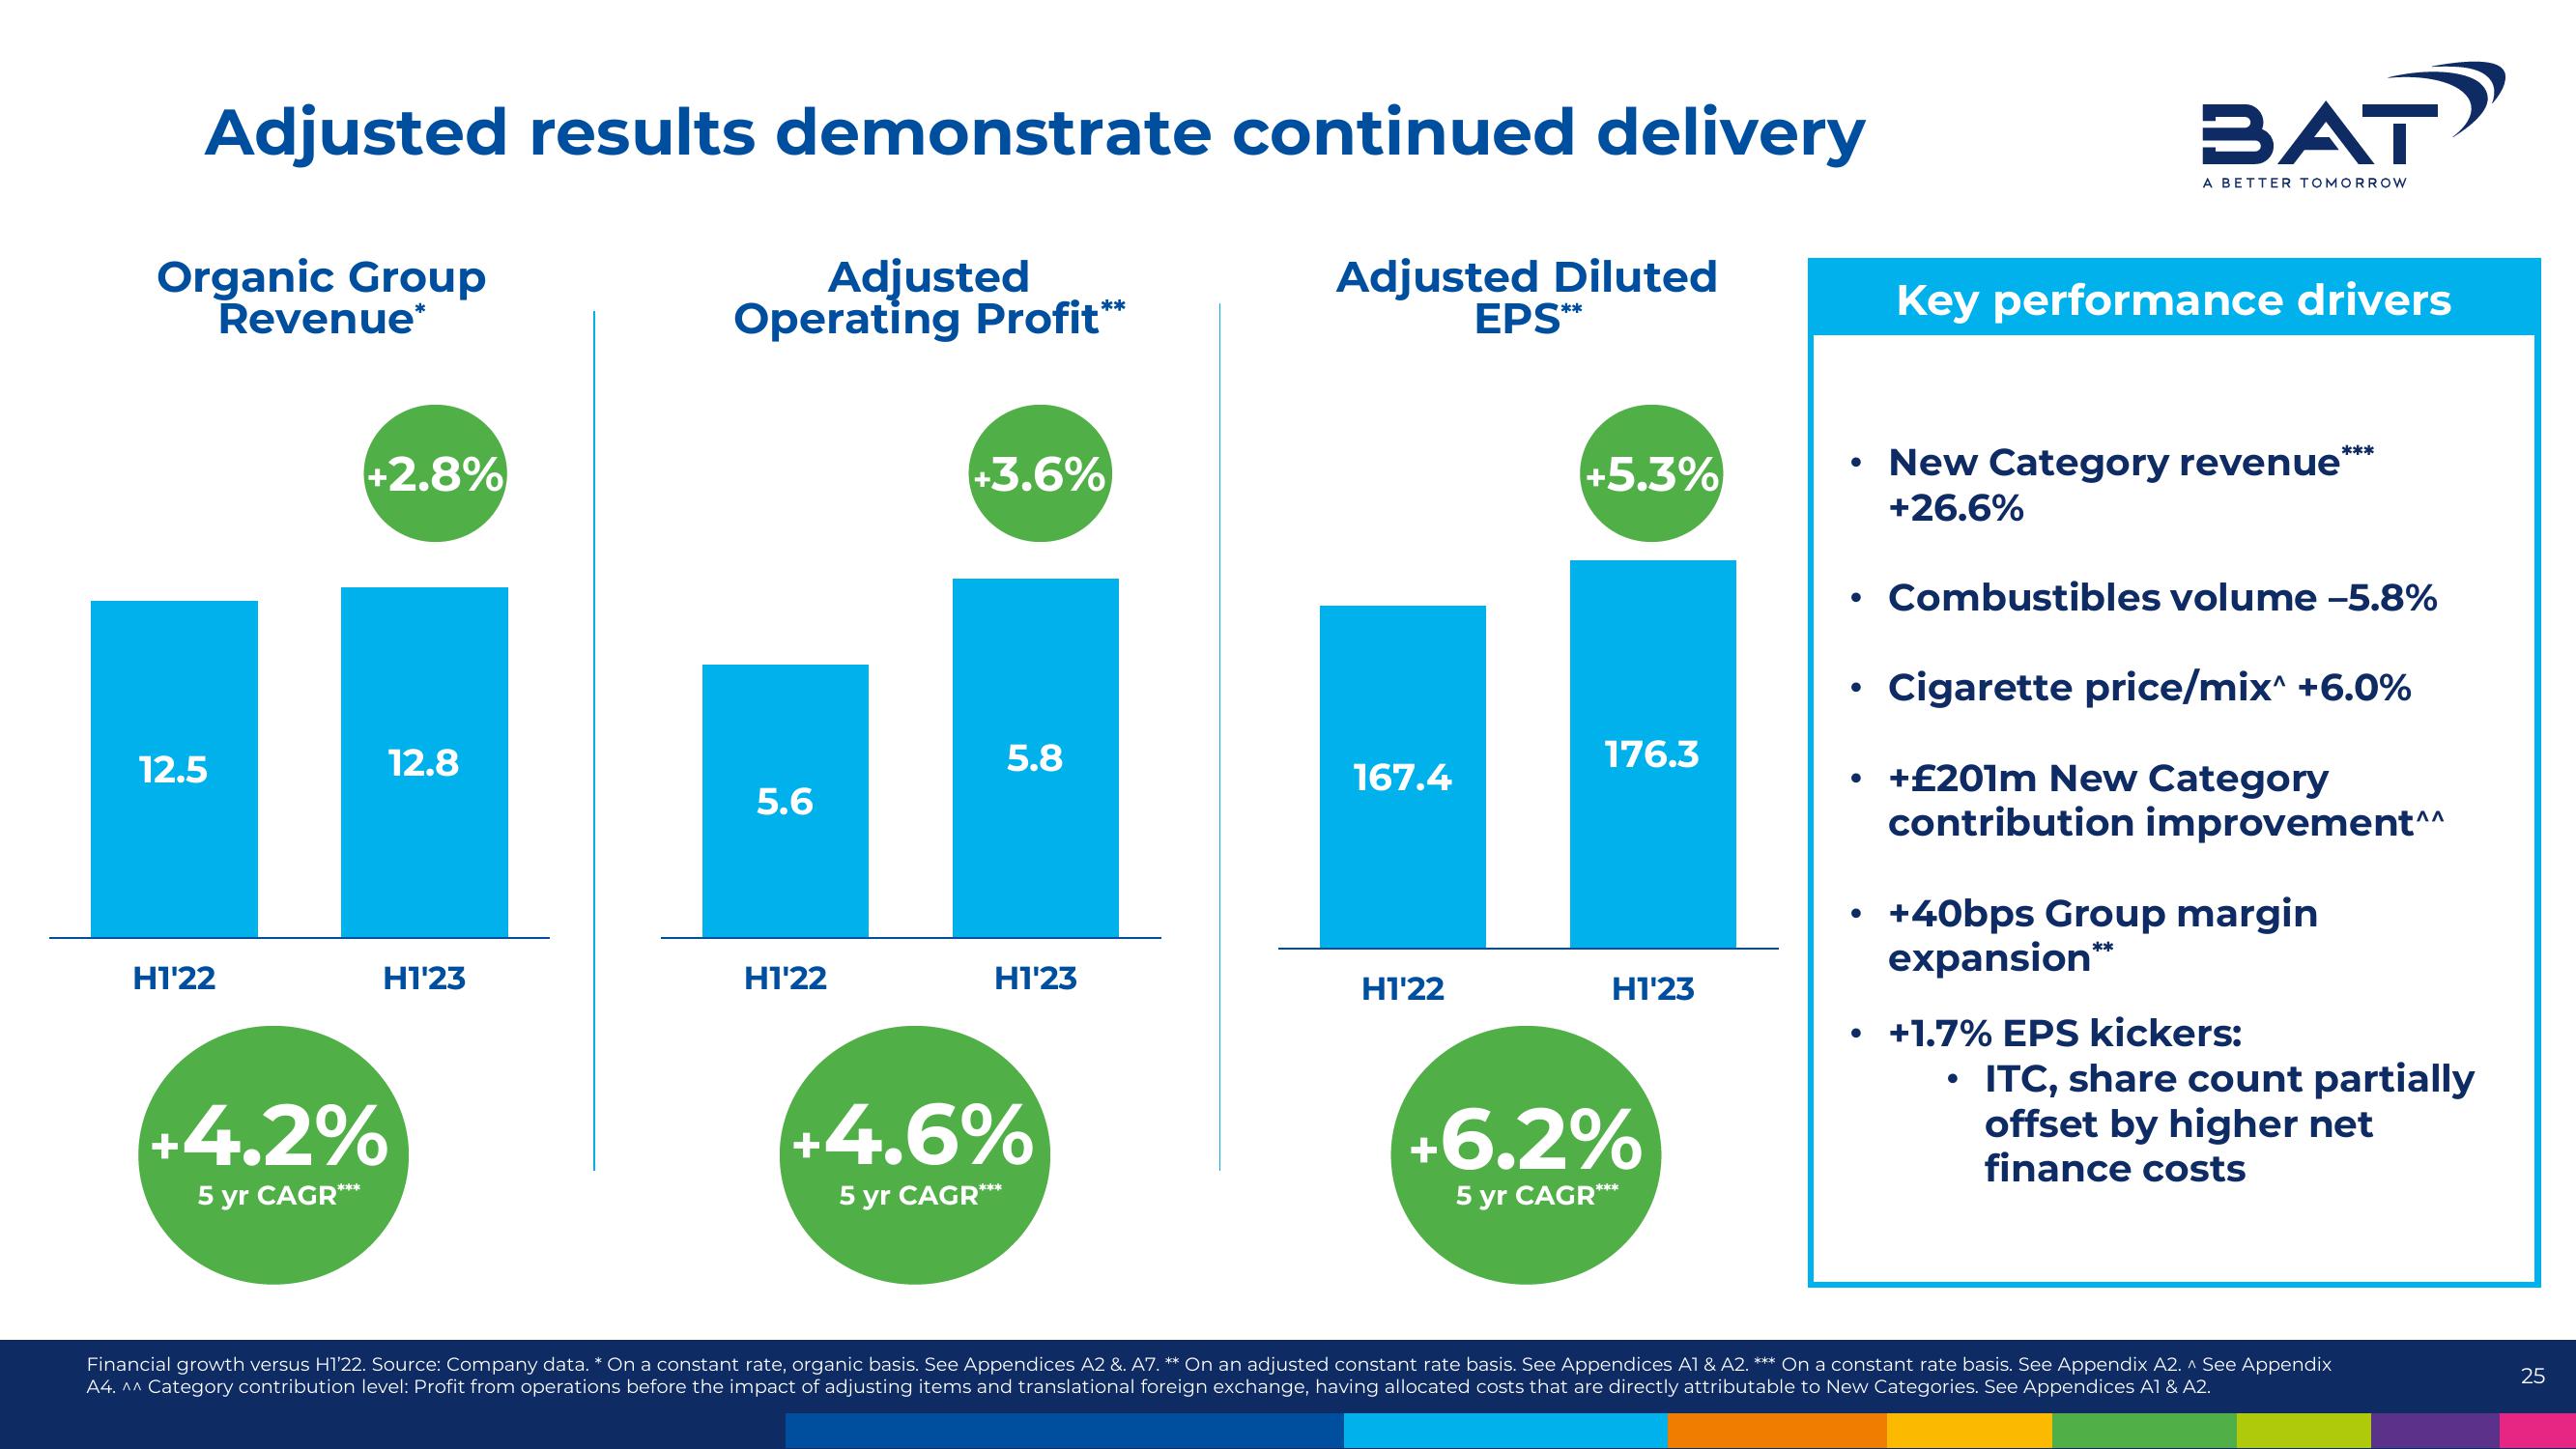
Adjusted results demonstrate continued delivery
Organic Group
Revenue*
12.5
H122
+2.8%
+4.2%
5 yr CAGR***
12.8
H1'23
Adjusted
Operating Profit**
5.6
H122
+3.6%
5.8
H1'23
+4.6%
5 yr CAGR***
Adjusted Diluted
167.4
H122
EPS**
+5.3%
176.3
H1'23
+6.2%
5 yr CAGR***
●
●
BAT
A BETTER TOMORROW
Key performance drivers
New Category revenue
+26.6%
Combustibles volume -5.8%
Cigarette price/mix^ +6.0%
• + £201m New Category
contribution improvement^^
+40bps Group margin
expansion**
●
+1.7% EPS kickers:
***
ITC, share count partially
offset by higher net
finance costs
Financial growth versus H1'22. Source: Company data. * On a constant rate, organic basis. See Appendices A2 &. A7. ** On an adjusted constant rate basis. See Appendices A1 & A2. *** On a constant rate basis. See Appendix A2. ^ See Appendix
A4. ^^ Category contribution level: Profit from operations before the impact of adjusting items and translational foreign exchange, having allocated costs that are directly attributable to New Categories. See Appendices A1 & A2.
25View entire presentation