BigCommerce Results Presentation Deck
Non-GAAP reconciliation
Figures in thousands
Gross Profit
GAAP Gross Profit
Stock-based Compensation (¹)
Non-GAAP Gross Profit
Non-GAAP Gross Margin
Sales & Marketing
GAAP S&M Expense
Stock-based Compensation(¹)
Non-GAAP S&M Expense
Non-GAAP S&M as % of Revenue
Research & Development
GAAP R&D Expense
Stock-based Compensation (¹)
Non-GAAP R&D Expense
Non-GAAP R&D as a % of Revenue
General & Administrative
GAAP G&A Expense
Stock-based Compensation (¹)
Non-GAAP G&A Expense
Non-GAAP G&A as % of Revenue
Operating Loss
GAAP Operating Loss
Stock-based Compensation(¹)
Acquisition Related Expenses
Restructuring Charges
Amortization of Intangible Assets
Non-GAAP Operating Loss
Non-GAAP Operating Margin
Q1'21 Q2'21 Q3'21
$37,410 $38,828 $46,882
415
545
310
$37,825 $39,373 $47,192
81%
80%
80%
$21,960 $23,676
1,913
$20,047
43%
$13,535
1,267
$12,268
26%
$10,457
1,824
$8,633
19%
$27,438
2,461
2,192
$21,215 $25,246
43%
43%
($3,123)
(7%)
$14,725 $16,532
1,526
1,624
$13,199 $14,908
27%
25%
$11,591
2,405
$9,186
19%
$13,033
2,167
$ 10,866
18%
($4,227)
(9%)
Q4'21 FY 2021
$48,256 $171,376
852
2,122
$49,108 $173,498
76%
79%
1,402
($3,828)
(6%)
$31,771 $104,845
2,828 9,394
$28,943 $95,451
45%
43%
Q2'22
Q1'22
$48,947 $51,343
868
987
$49,815 $52,330
75%
77%
$16,263 $51,344
2,454 8,850
$13,809 $42,495
21%
19%
$33,639 $36,033
2,975 3,567
$30,664 $32,466
46%
48%
($8,542) ($12,271) ($21,315) ($33,815) ($75,943) ($36,179)
5,419
$6,937
1,107
$6,293
9,792
7,887 26,535
12,400 23,299
9,108
12,660
Q3'22
$54,866
1,091
$55,957
77%
$35,973
3,254
$32,719
45%
$15,846 $17,526 $18,932
2,702 3,338 3,296
$13,144 $14,188 $15,636
20%
21%
22%
($39,140) ($30,560)
10,934 10,785
6,260
12,521
Q4'22 FY 2022 Q1'23
$53,939 $209,095 $54,311
1,280 4,226
1,189
$55,219 $213,321 $55,500
76%
76%
77%
$19,755 $64,547 $20,944 $22,394 $22,245 $22,669 $88,253 $20,845 $21,403
1,753 6,170 2,563 3,042
3,144 3,639 12,388
3,503 3,943
$18,003 $58,377 $18,381 $19,352 $19,101 $19,030 $75,865 $17,342 $17,460
28%
27%
28%
28%
26%
26%
27%
24%
23%
1,882 3,284 2,037 2,009
2,016
($11,647) ($22,825) ($12,374) ($13,676) ($11,499)
(18%) (10%) (19%) (20%) (16%)
$35,697 $141,342
3,757 13,553
$31,940 $127,789
44%
46%
$34,052
2,867
$31,185
43%
Q2'23
$56,687
1,290
$57,977
77%
$35,593
3,566
$32,027
43%
$17,137 $69,441 $16,494 $14,428
3,483 12,819 3,079
2,573
$13,654 $56,622 $13,415 $11,855
19%
20%
19%
16%
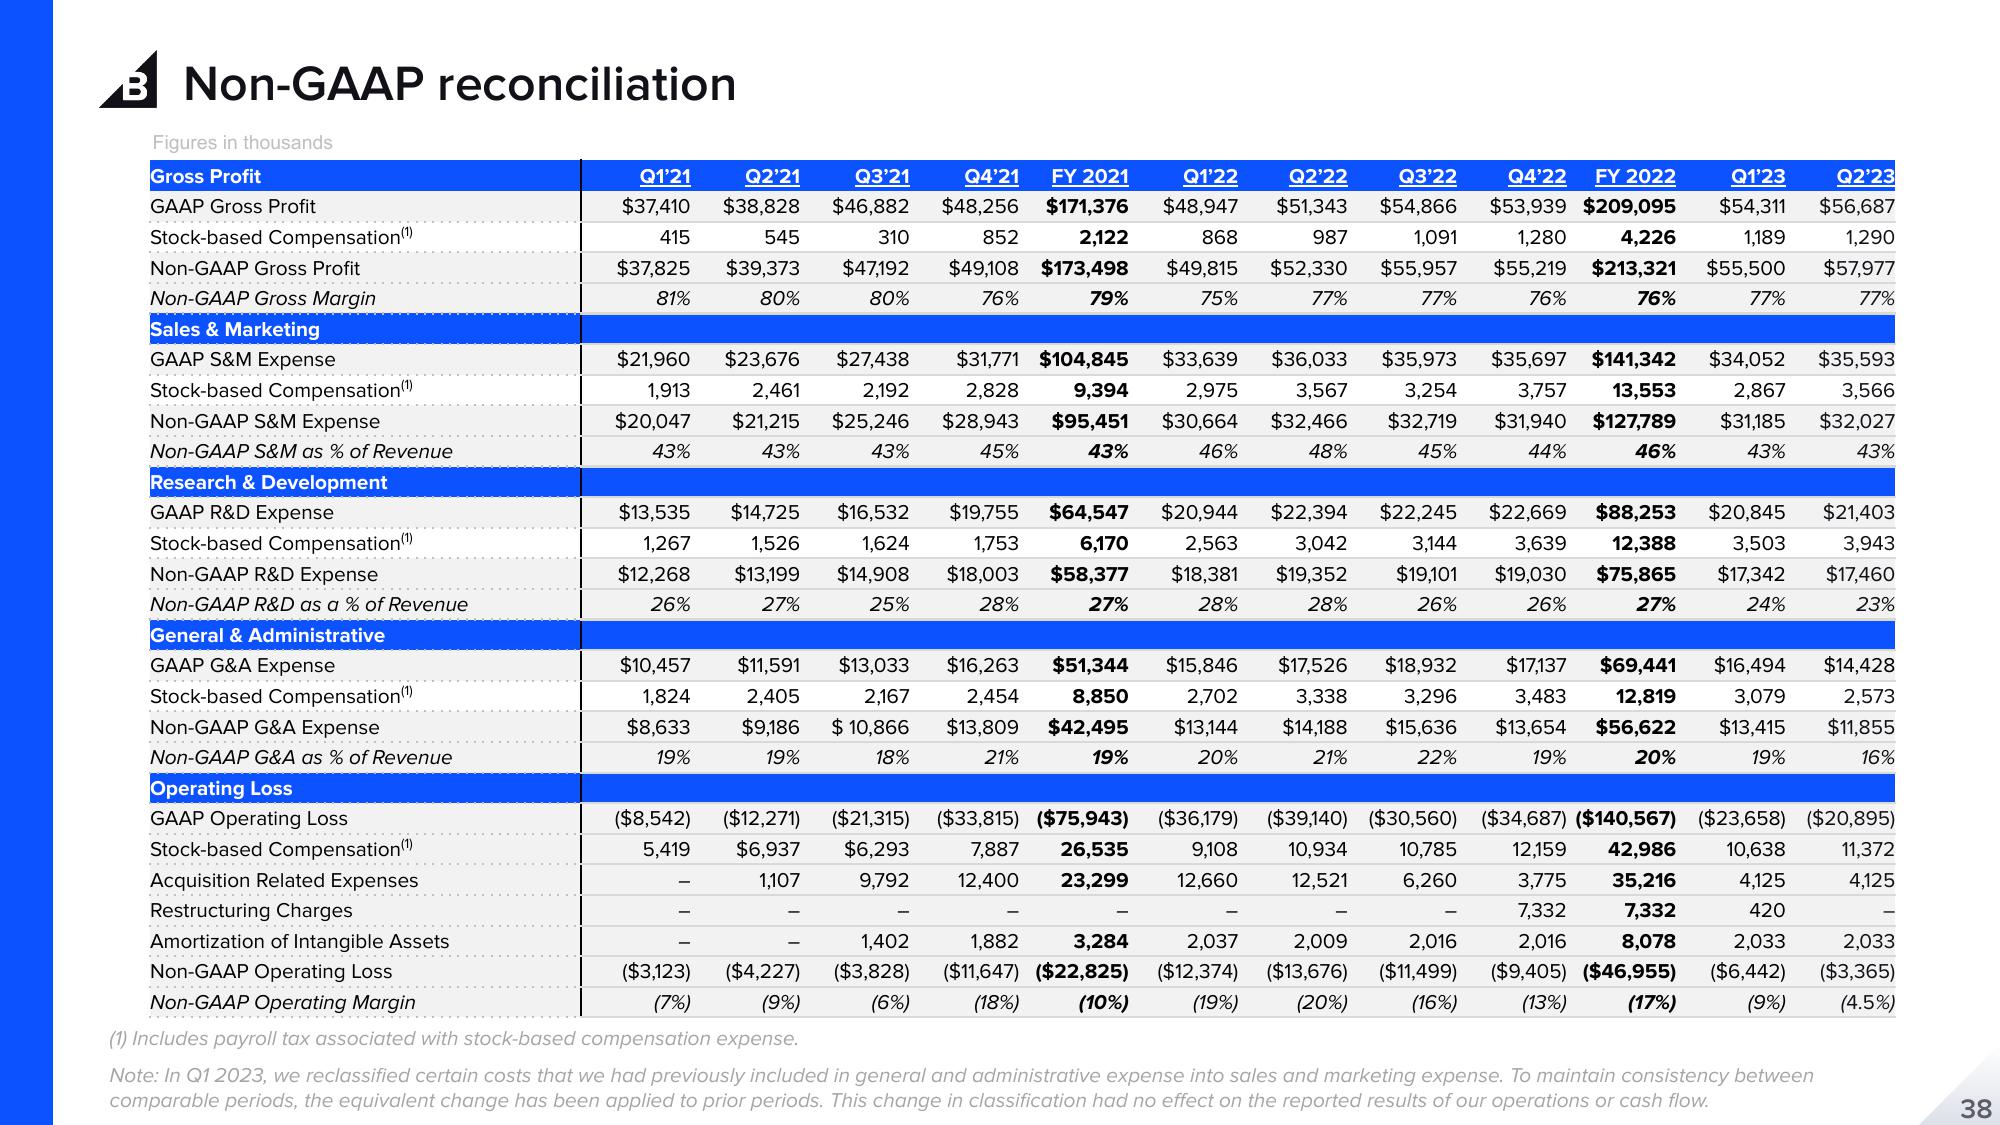
(1) Includes payroll tax associated with stock-based compensation expense.
Note: In Q1 2023, we reclassified certain costs that we had previously included in general and administrative expense into sales and marketing expense. To maintain consistency between
comparable periods, the equivalent change has been applied to prior periods. This change in classification had no effect on the reported results of our operations or cash flow.
($34,687) ($140,567) ($23,658) ($20,895)
12,159 42,986 10,638 11,372
4,125
420
4,125
3,775 35,216
7,332 7,332
2,016 8,078 2,033
($9,405) ($46,955) ($6,442)
(17%)
(13%)
(9%)
2,033
($3,365)
(4.5%)
38View entire presentation