Kore SPAC Presentation Deck
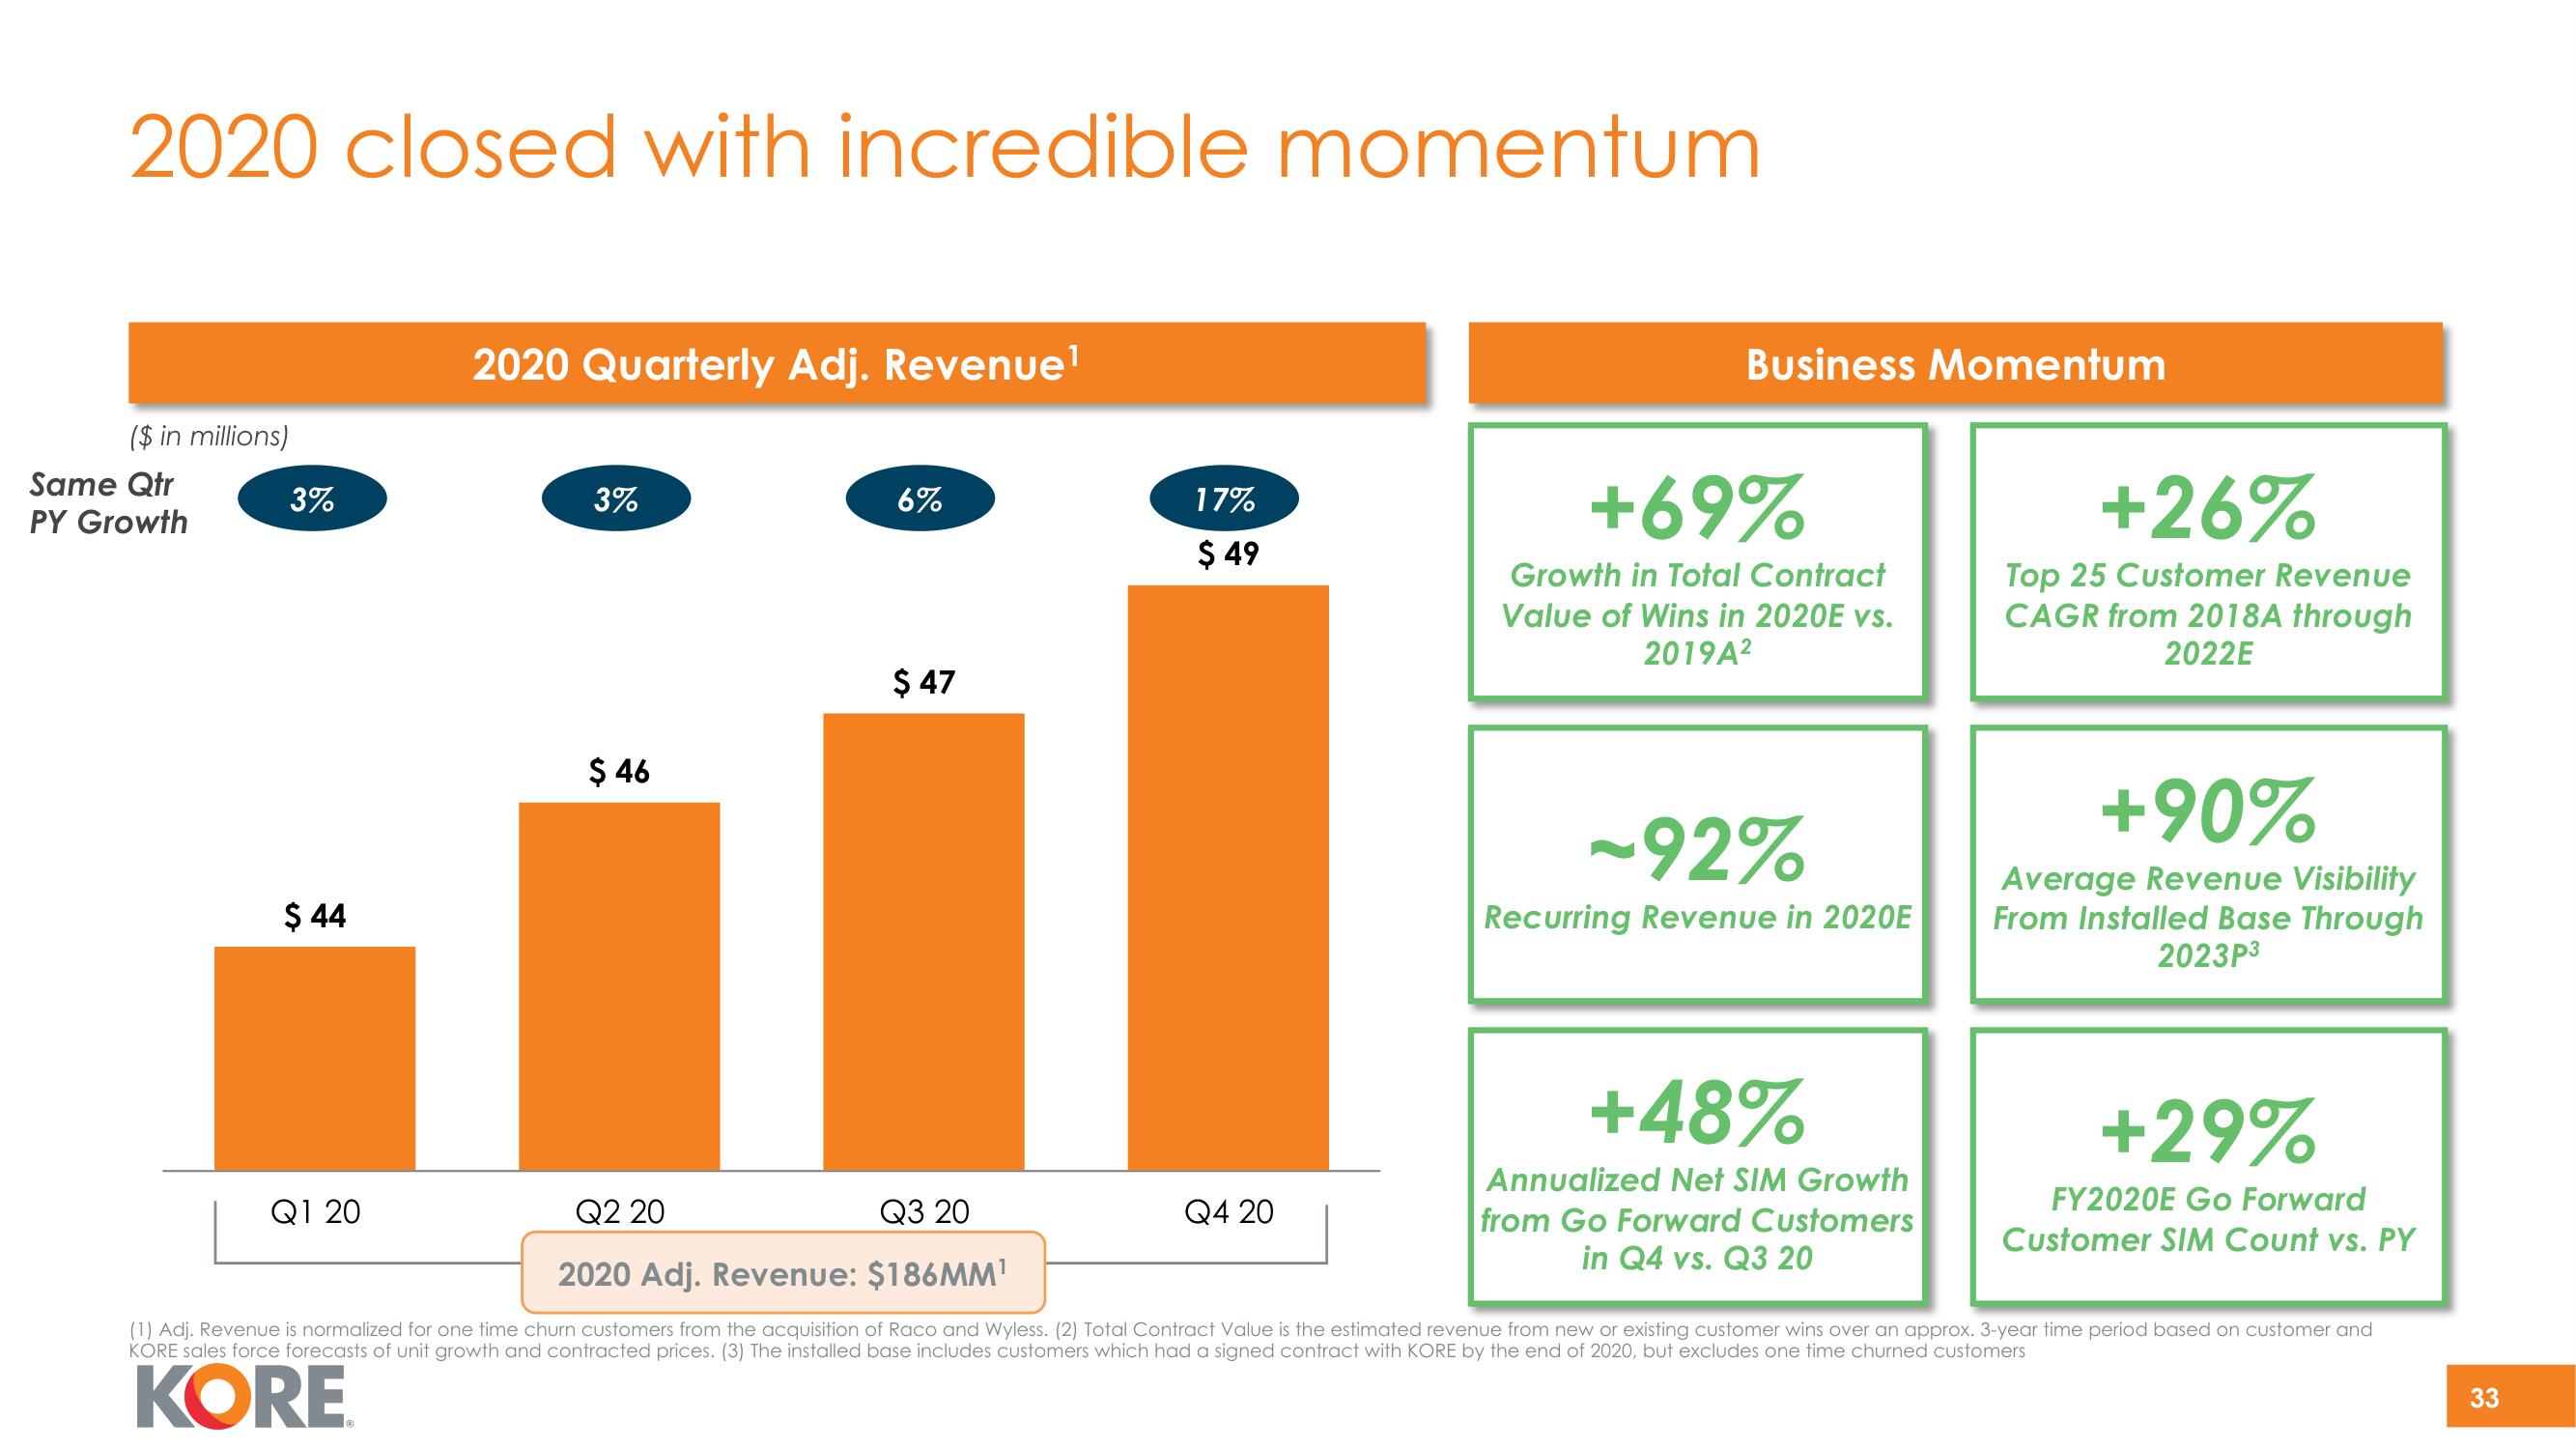
2020 closed with incredible momentum
($ in millions)
Same Qtr
PY Growth
3%
$ 44
Q1 20
2020 Quarterly Adj. Revenue¹
3%
$ 46
6%
$ 47
17%
$ 49
Q4 20
Business Momentum
+69%
Growth in Total Contract
Value of Wins in 2020E vs.
2019A²
-92%
Recurring Revenue in 2020E
+48%
Annualized Net SIM Growth
from Go Forward Customers
in Q4 vs. Q3 20
+26%
Top 25 Customer Revenue
CAGR from 2018A through
2022E
+90%
Average Revenue Visibility
From Installed Base Through
2023P3
Q2 20
Q3 20
2020 Adj. Revenue: $186MM¹
(1) Adj. Revenue is normalized for one time churn customers from the acquisition of Raco and Wyless. (2) Total Contract Value is the estimated revenue from new or existing customer wins over an approx. 3-year time period based on customer and
KORE sales force forecasts of unit growth and contracted prices. (3) The installed base includes customers which had a signed contract with KORE by the end of 2020, but excludes one time churned customers
KORE
+29%
FY2020E Go Forward
Customer SIM Count vs. PY
33View entire presentation