Silicon Valley Bank Results Presentation Deck
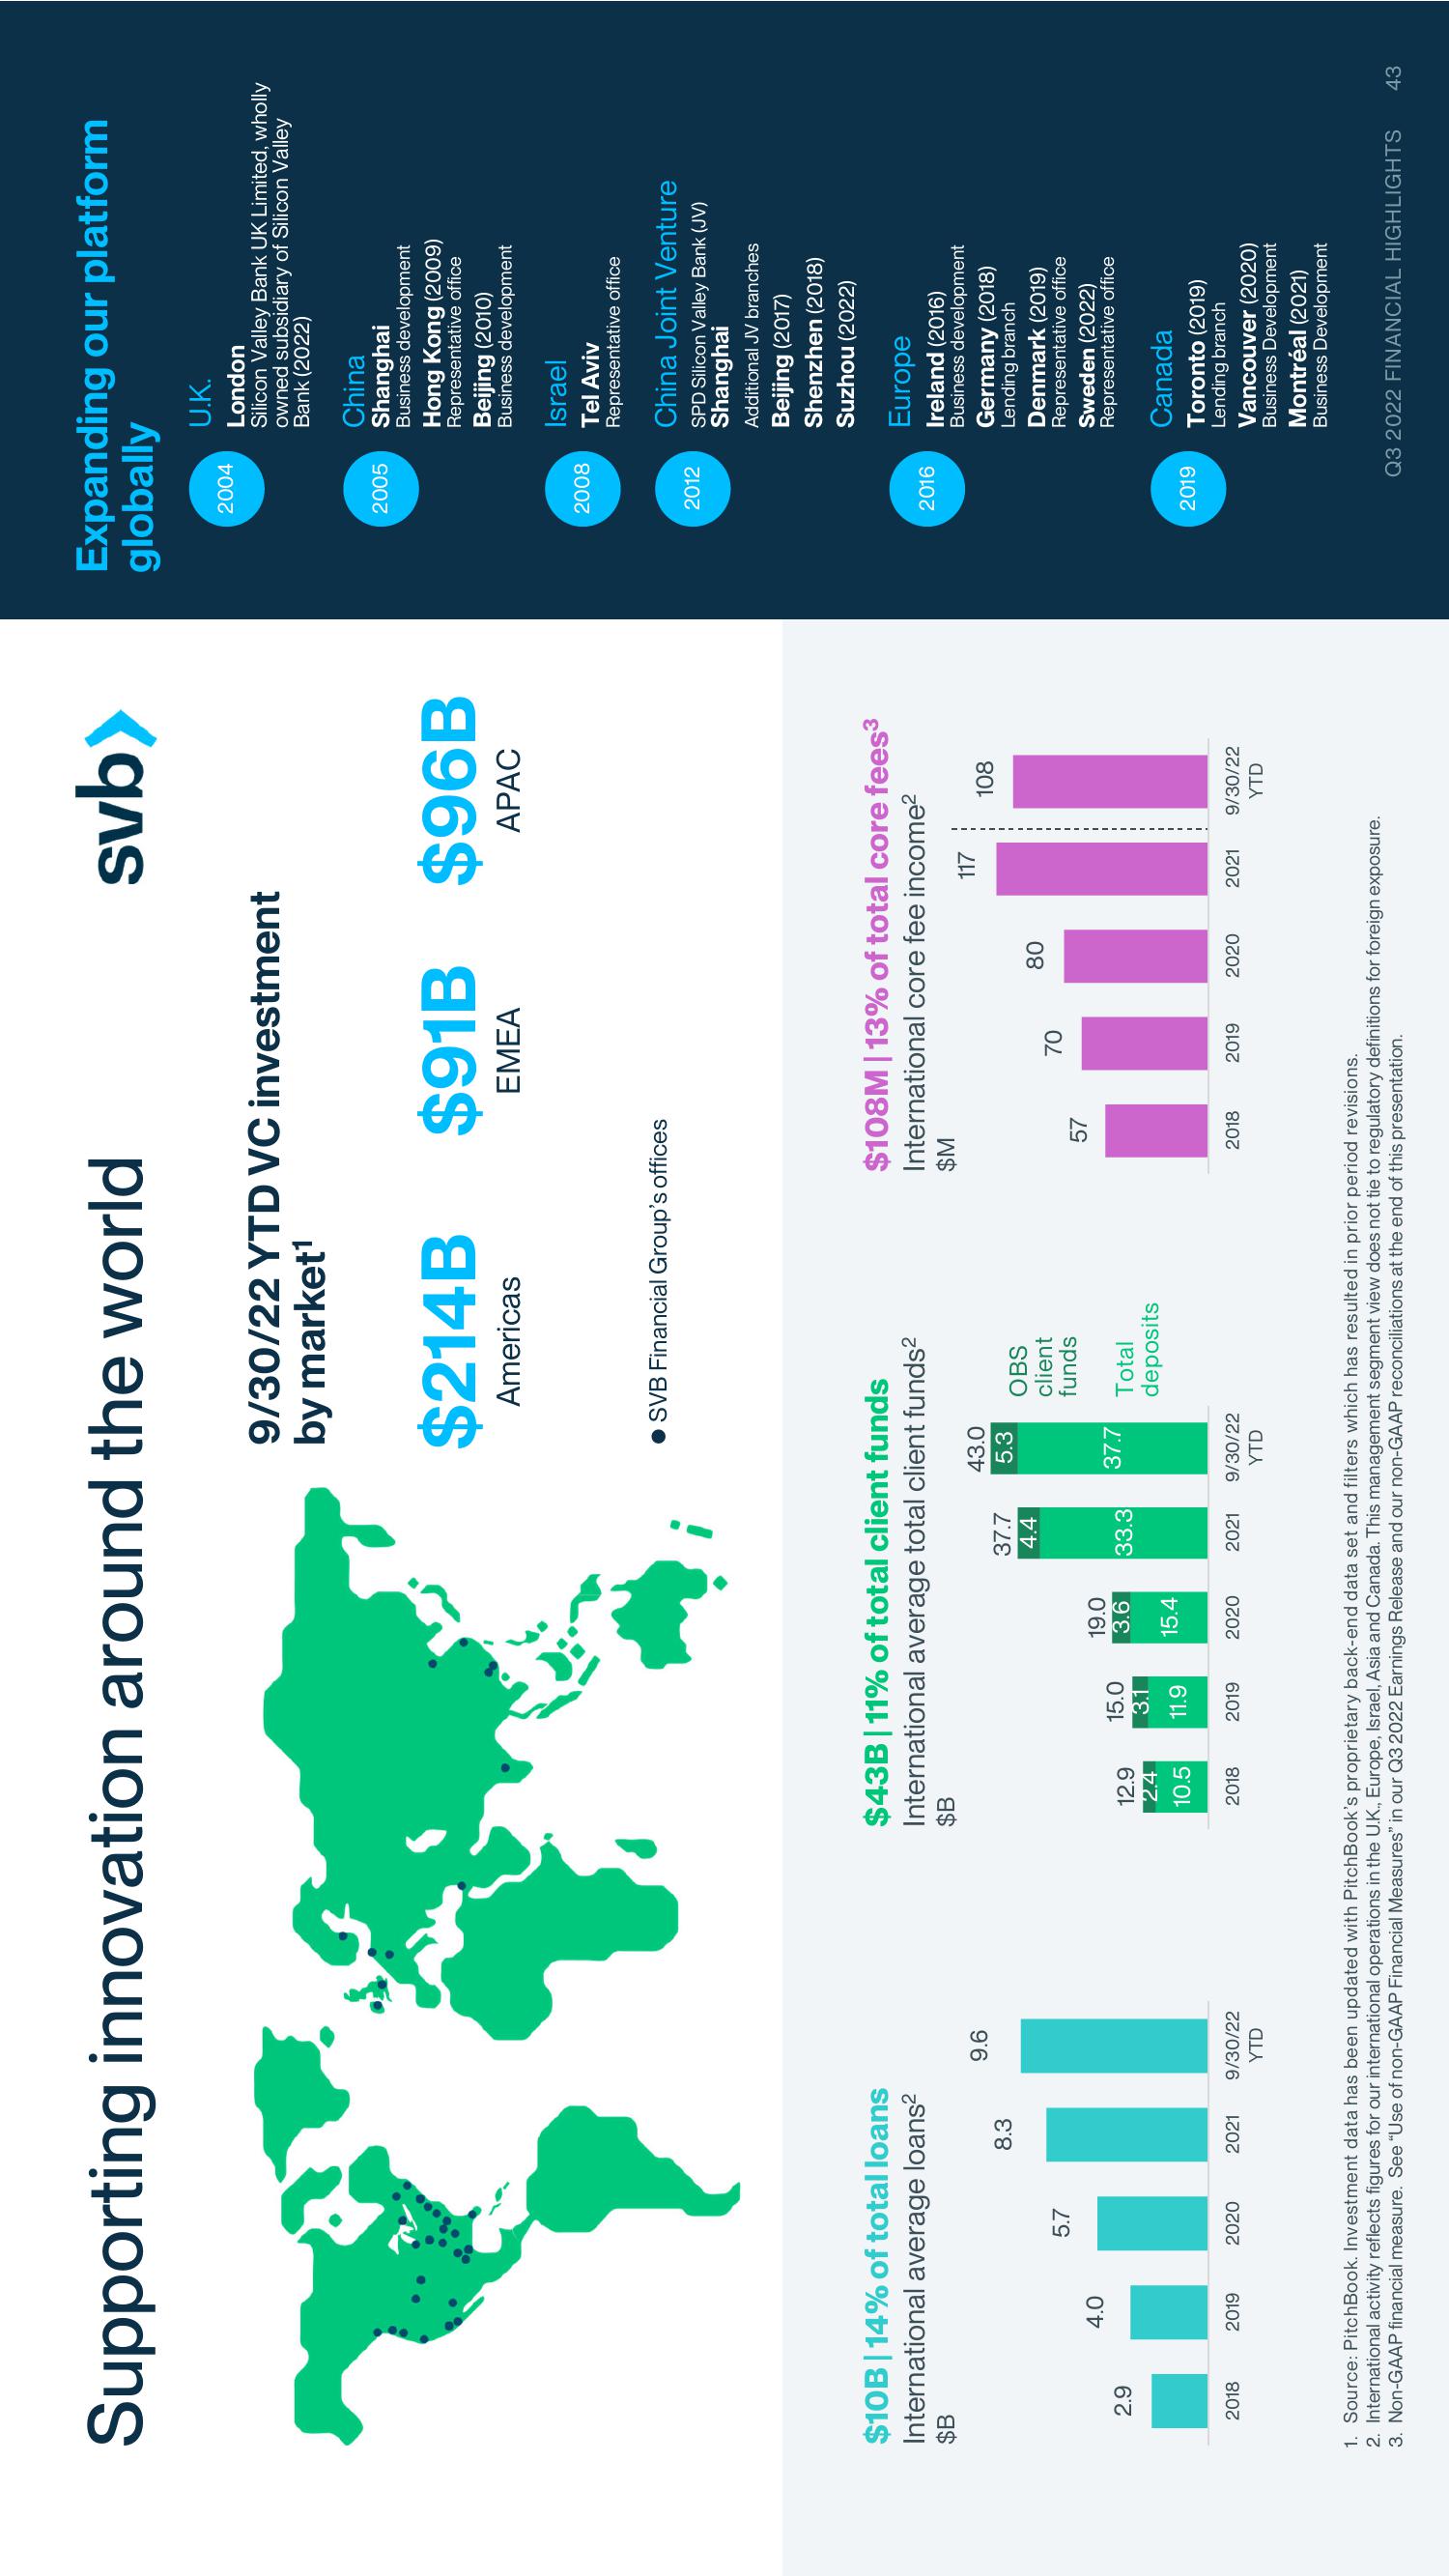
Supporting innovation around the world
$10B | 14% of total loans
International average loans²
$B
2.9
2018
4.0
2019
5.7
2020
8.3
2021
9.6
9/30/22
YTD
$B
12.9
2.4
10.5
$43B | 11% of total client funds
International average total client funds²
2018
15.0
3.1
11.9
2019
19.0
3.6
15.4
2020
9/30/22 YTD VC investment
by market¹
33.3
$214B
Americas
43.0
37.7 5.3
4.4
2021
37.7
SVB Financial Group's offices
9/30/22
YTD
OBS
client
funds
Total
deposits
$91B $96B
EMEA
APAC
$108M | 13% of total core fees³
International core fee income²
$M
57
2018
70
svb>
2019
117
108
80
ill
2020
2021
9/30/22
YTD
1. Source: PitchBook. Investment data has been updated with PitchBook's proprietary back-end data set and filters which has resulted in prior period revisions.
2. International activity reflects figures for our international operations in the U.K., Europe, Israel, Asia and Canada. This management segment view does not tie to regulatory definitions for foreign exposure.
3. Non-GAAP financial measure. See "Use of non-GAAP Financial Measures" in our Q3 2022 Earnings Release and our non-GAAP reconciliations at the end of this presentation.
Expanding our platform
globally
2004
2005
2008
2012
2016
2019
U.K.
London
Silicon Valley Bank UK Limited, wholly
owned subsidiary of Silicon Valley
Bank (2022)
China
Shanghai
Business development
Hong Kong (2009)
Representative office
Beijing (2010)
Business development
Israel
Tel Aviv
Representative office
China Joint Venture
SPD Silicon Valley Bank (JV)
Shanghai
Additional JV branches
Beijing (2017)
Shenzhen (2018)
Suzhou (2022)
Europe
Ireland (2016)
Business development
Germany (2018)
Lending branch
Denmark (2019)
Representative office
Sweden (2022)
Representative office
Canada
Toronto (2019)
Lending branch
Vancouver (2020)
Business Development
Montréal (2021)
Business Development
Q3 2022 FINANCIAL HIGHLIGHTS 43View entire presentation