SmileDirectClub Investor Presentation Deck
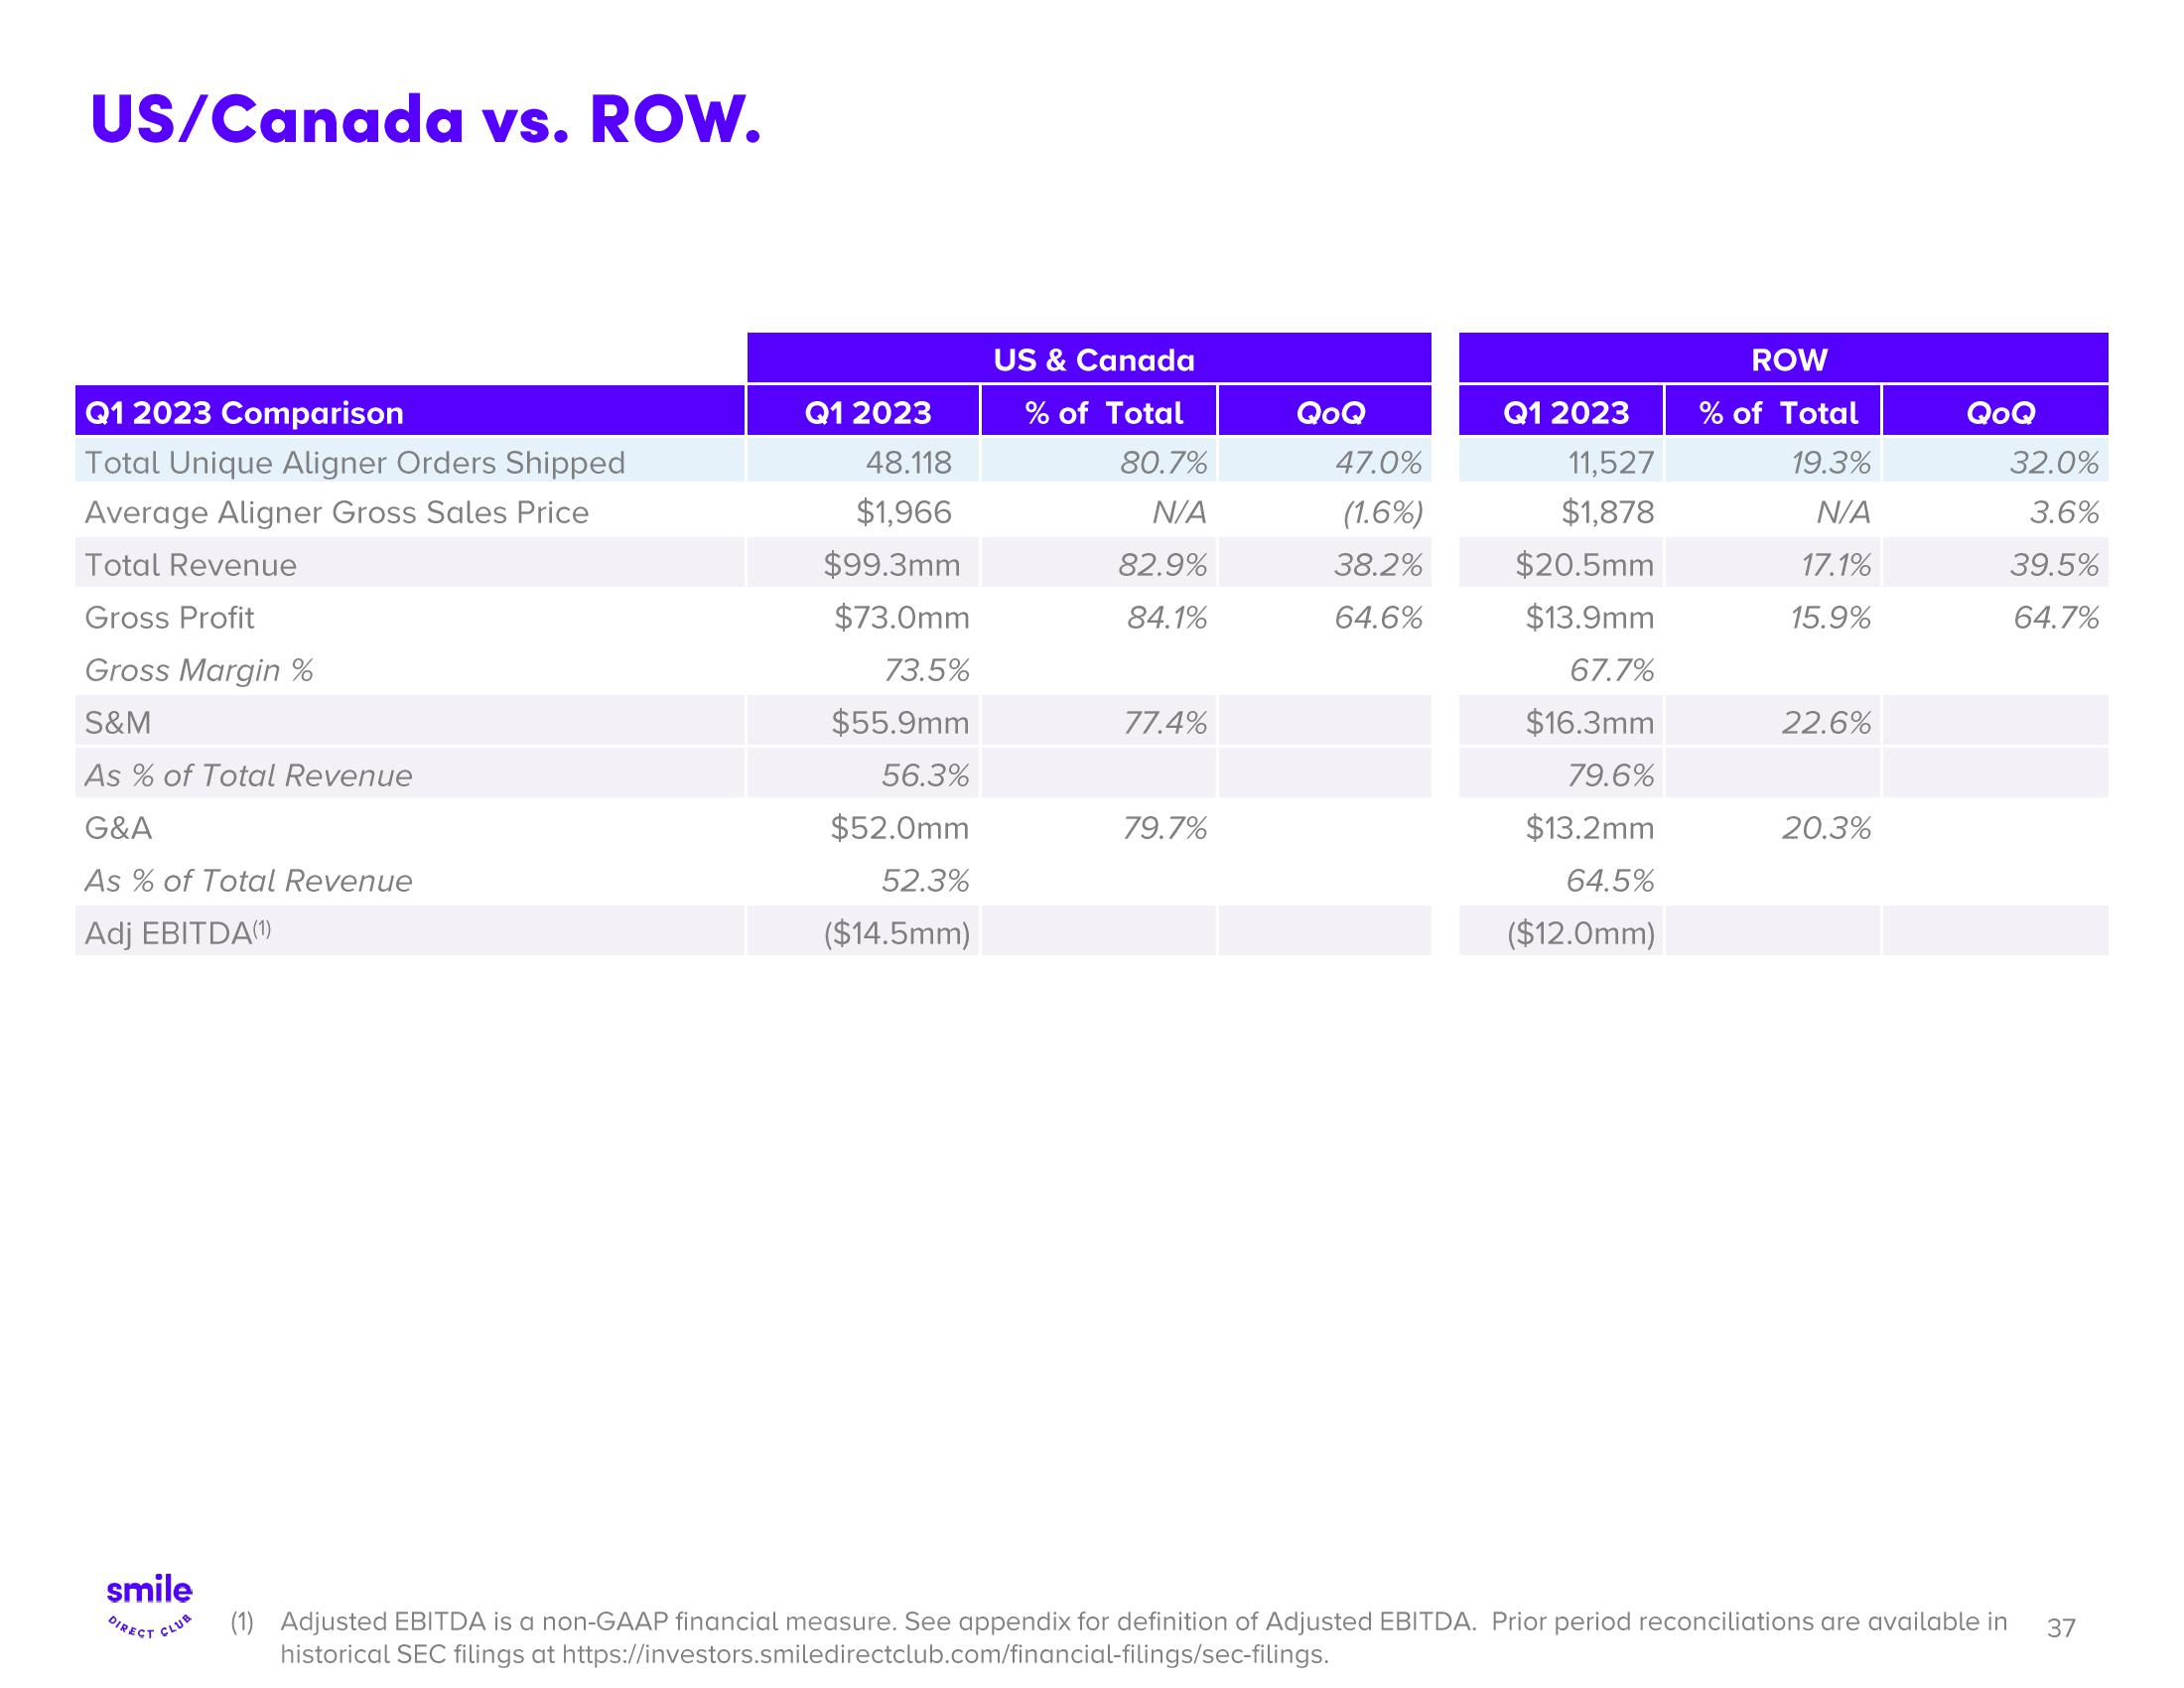
US/Canada vs. ROW.
Q1 2023 Comparison
Total Unique Aligner Orders Shipped
Average Aligner Gross Sales Price
Total Revenue
Gross Profit
Gross Margin %
S&M
As % of Total Revenue
G&A
As % of Total Revenue
Adj EBITDA(1)
smile
DIRECT CLUB
Q1 2023
48.118
$1,966
$99.3mm
$73.0mm
73.5%
$55.9mm
56.3%
$52.0mm
52.3%
($14.5mm)
US & Canada
% of Total
80.7%
N/A
82.9%
84.1%
77.4%
79.7%
QoQ
47.0%
(1.6%)
38.2%
64.6%
Q1 2023
11,527
$1,878
$20.5mm
$13.9mm
67.7%
$16.3mm
79.6%
$13.2mm
64.5%
($12.0mm)
ROW
% of Total
19.3%
N/A
17.1%
15.9%
22.6%
20.3%
QoQ
(1) Adjusted EBITDA is a non-GAAP financial measure. See appendix for definition of Adjusted EBITDA. Prior period reconciliations are available in
historical SEC filings at https://investors.smiledirectclub.com/financial-filings/sec-filings.
32.0%
3.6%
39.5%
64.7%
37View entire presentation