Bed Bath & Beyond Results Presentation Deck
Q3 PERFORMANCE HIGHLIGHTS & TRANSFORMATION UPDATE
unlocked cash flow generation of $244mn;
effective return of $225mn to shareholders;
maintained strong total liquidity of $2.2bn
Q3 actions maintained strong cash position:
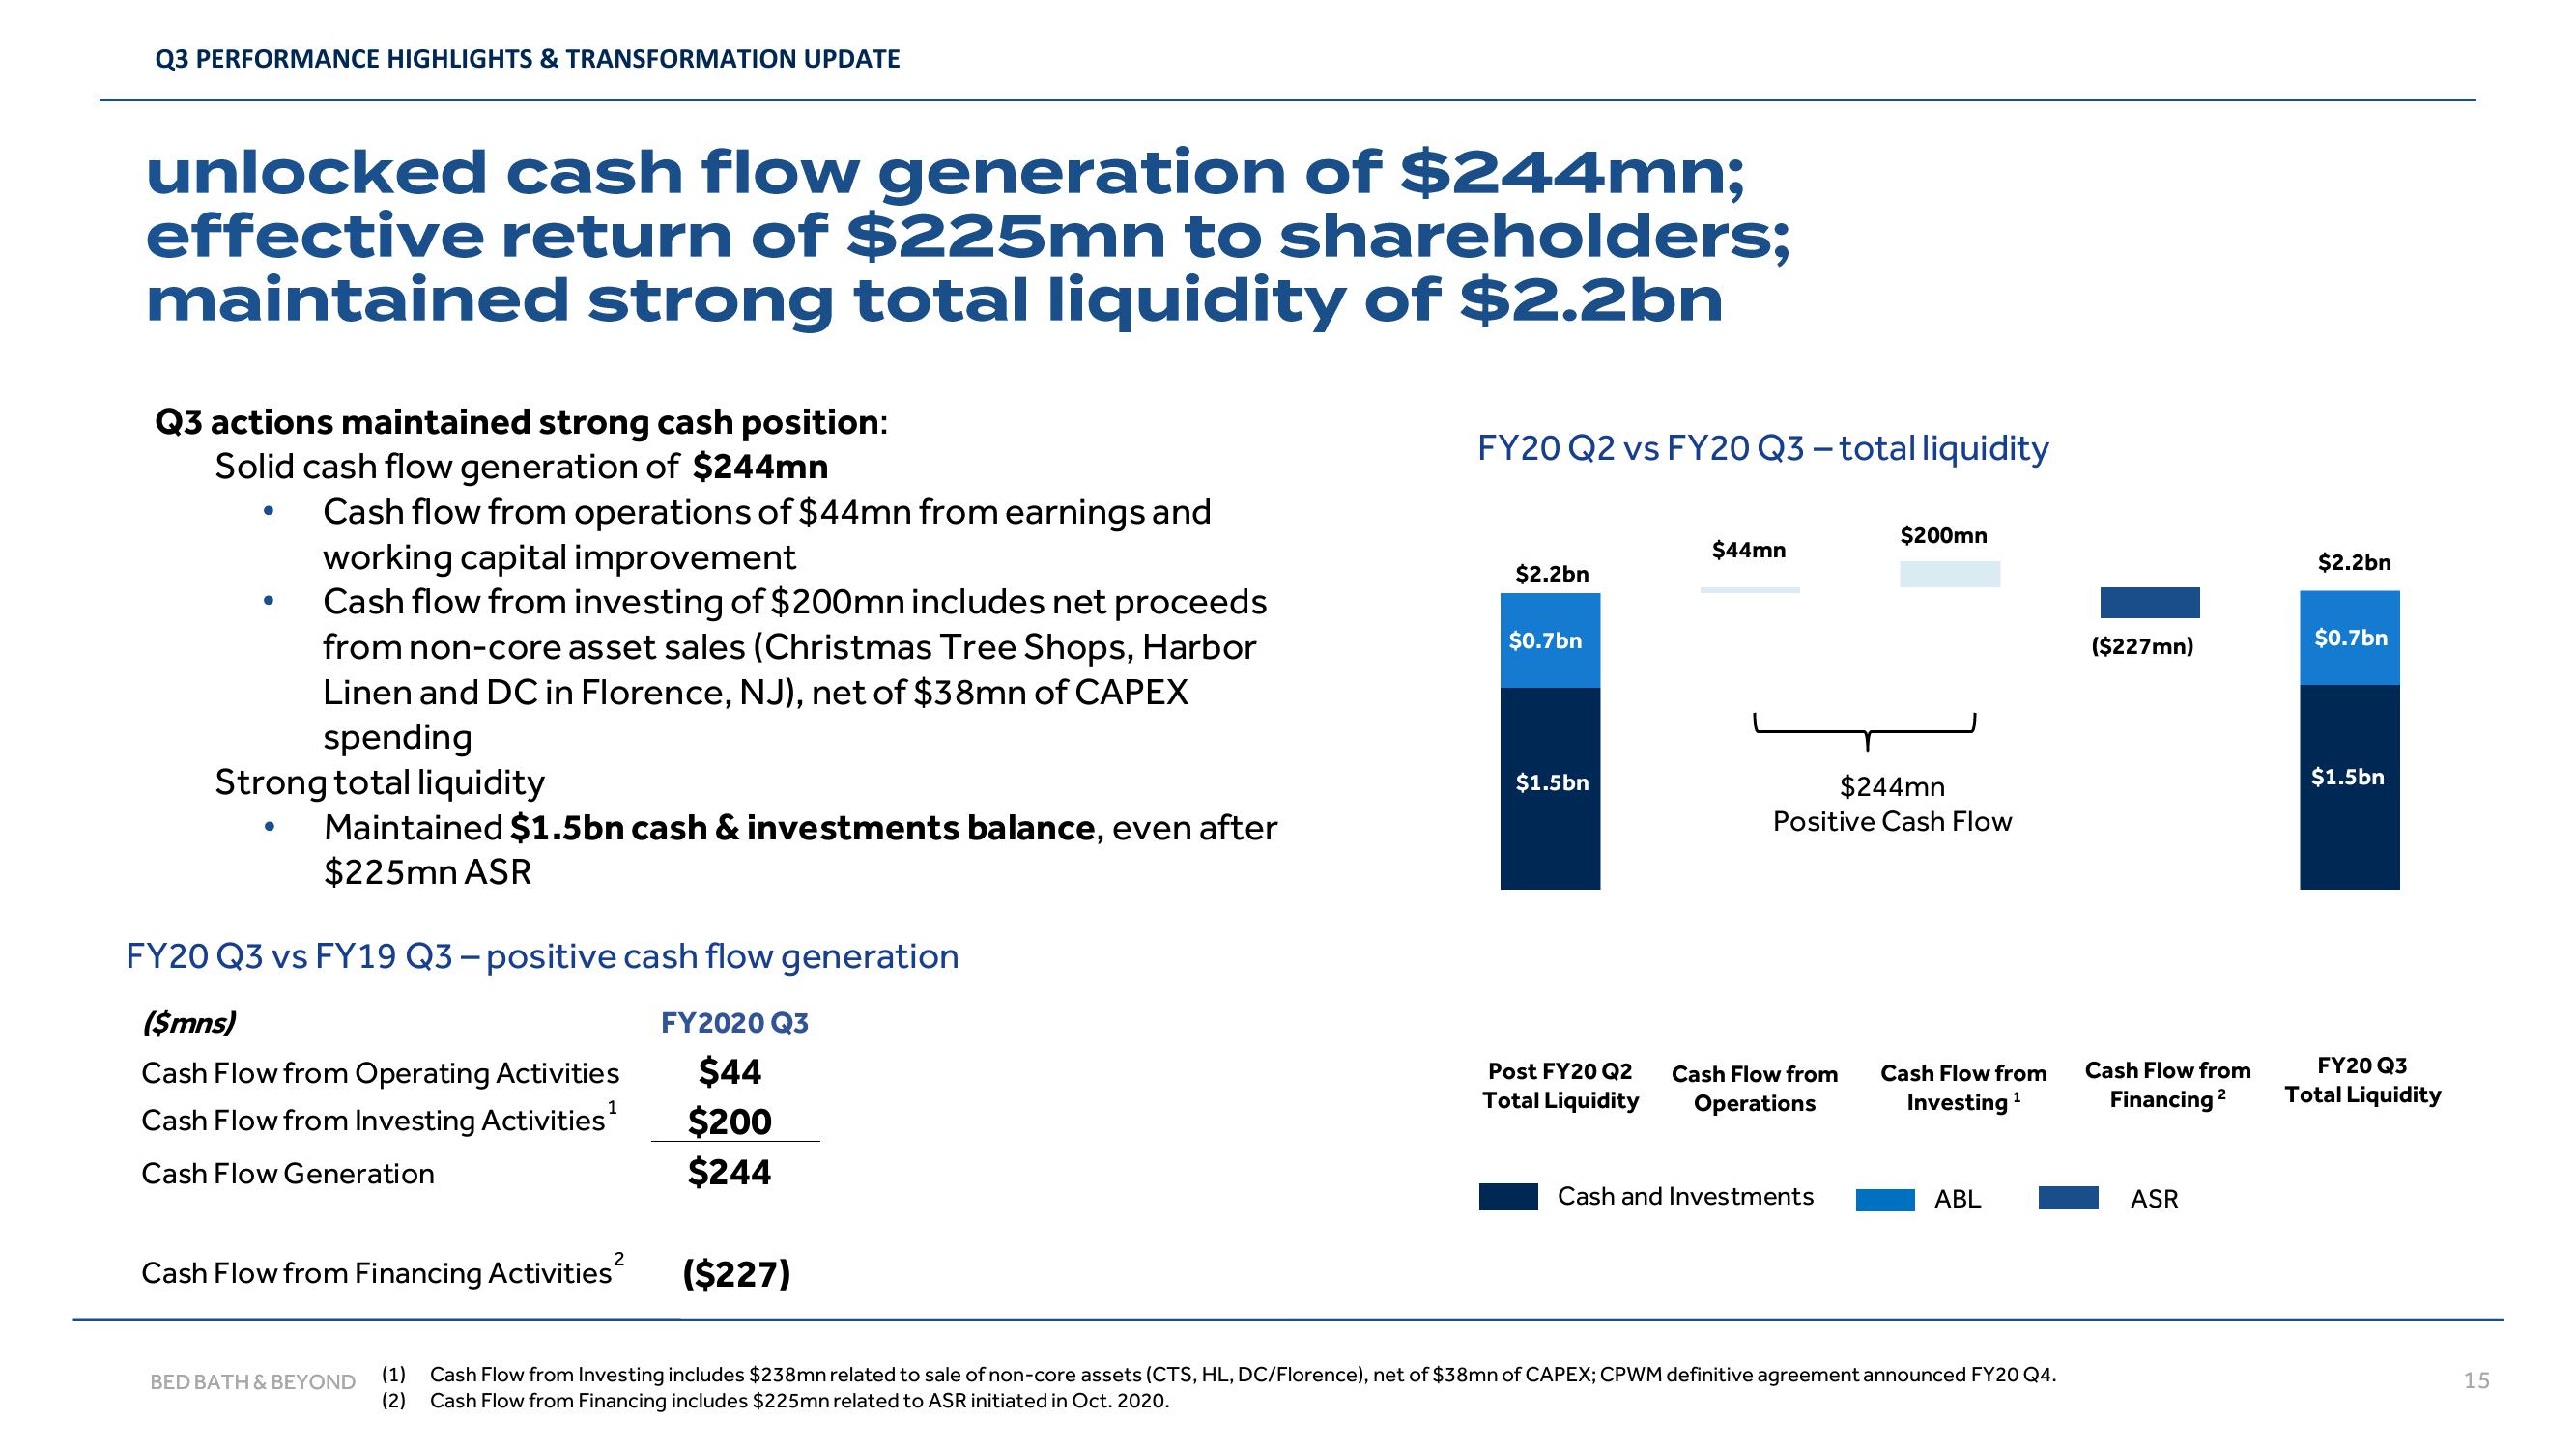
Solid cash flow generation of $244mn
●
●
Cash flow from operations of $44mn from earnings and
working capital improvement
Cash flow from investing of $200mn includes net proceeds
from non-core asset sales (Christmas Tree Shops, Harbor
Linen and DC in Florence, NJ), net of $38mn of CAPEX
spending
Strong total liquidity
Maintained $1.5bn cash & investments balance, even after
$225mn ASR
FY20 Q3 vs FY19 Q3-positive cash flow generation
($mns)
FY2020 Q3
Cash Flow from Operating Activities
$44
1
Cash Flow from Investing Activities ¹
$200
Cash Flow Generation
$244
Cash Flow from Financing Activities ²
BED BATH & BEYOND
($227)
FY20 Q2 vs FY20 Q3 - total liquidity
$2.2bn
$0.7bn
$1.5bn
Post FY20 Q2
Total Liquidity
$44mn
$244mn
Positive Cash Flow
Cash Flow from
Operations
$200mn
Cash and Investments
Cash Flow from
Investing ¹
ABL
(1) Cash Flow from Investing includes $238mn related to sale of non-core assets (CTS, HL, DC/Florence), net of $38mn of CAPEX; CPWM definitive agreement announced FY20 Q4.
(2) Cash Flow from Financing includes $225mn related to ASR initiated in Oct. 2020.
($227mn)
Cash Flow from
Financing ²
2
ASR
$2.2bn
$0.7bn
$1.5bn
FY20 Q3
Total Liquidity
15View entire presentation