Affirm Results Presentation Deck
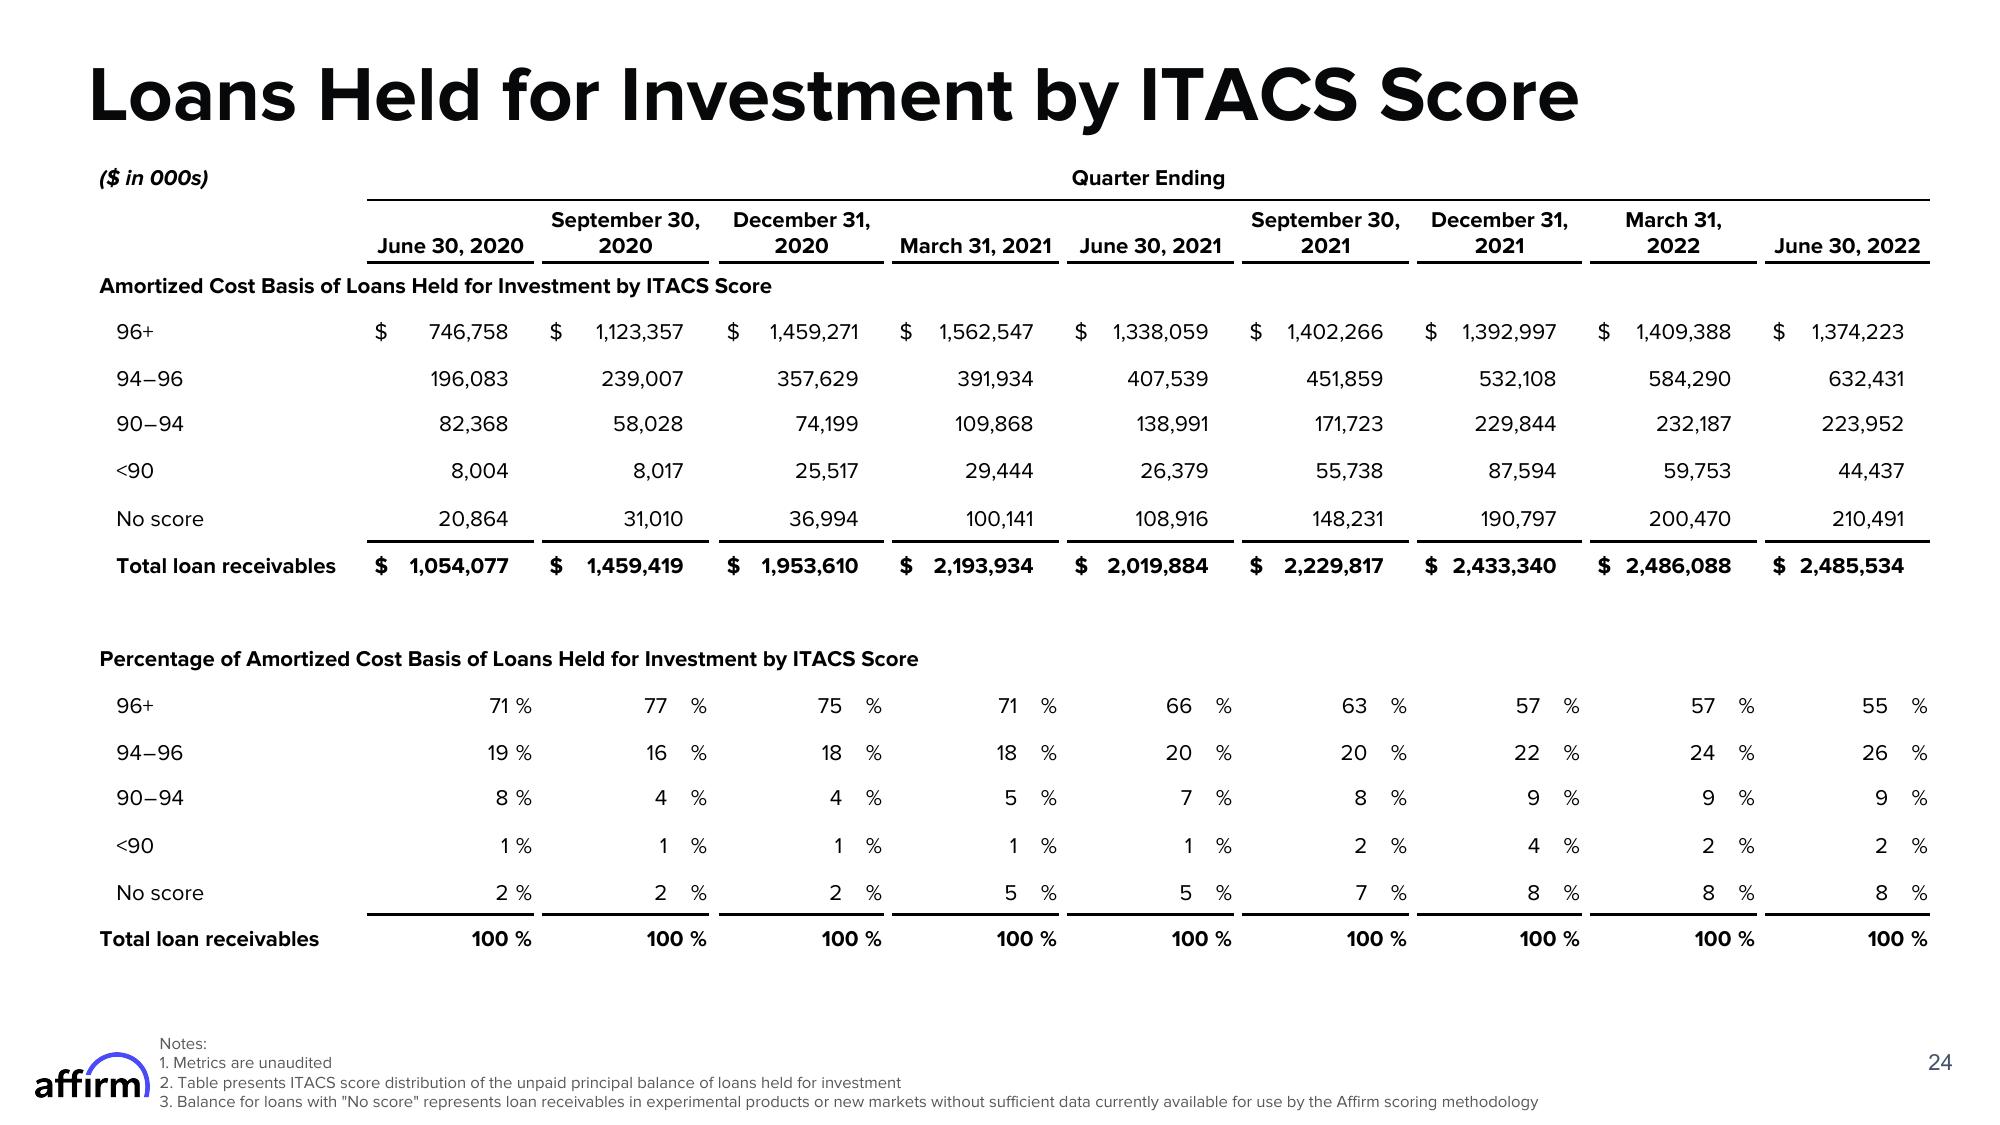
Loans Held for Investment by ITACS Score
($ in 000s)
September 30,
2020
June 30, 2020
Amortized Cost Basis of Loans Held for Investment by ITACS Score
96+
$
94-96
90-94
196,083
82,368
8,004
20,864
Total loan receivables $ 1,054,077
<90
No score
96+
94-96
90-94
<90
No score
Total loan receivables
746,758 $ 1,123,357 $ 1,459,271
239,007
357,629
58,028
74,199
25,517
36,994
$ 1,459,419 $ 1,953,610 $ 2,193,934
Percentage of Amortized Cost Basis of Loans Held for Investment by ITACS Score
71%
77 %
19 %
8%
1%
2%
8,017
100 %
31,010
16 %
4 %
December 31,
2020
1 %
2 %
100 %
75 %
18 %
4 %
1
do
%
March 31, 2021
2%
100 %
$ 1,562,547
391,934
109,868
29,444
100,141
71 %
18 %
5 %
1 %
5 %
100 %
Quarter Ending
June 30, 2021
$1,338,059
407,539
138,991
26,379
108,916
$ 2,019,884
66 %
20 %
7 %
1 %
5 %
100 %
September 30,
2021
$1,402,266
451,859
171,723
55,738
148,231
$2,229,817
63 %
20 %
8
2
%
do
%
7 %
100 %
December 31,
2021
$ 1,392,997
532,108
229,844
87,594
190,797
$ 2,433,340
57 %
22 %
9 %
4 %
8 %
100 %
Notes:
1. Metrics are unaudited
affirm 2. Table presents ITACS score distribution of the unpaid principal balance of loans held for investment
3. Balance for loans with "No score" represents loan receivables in experimental products or new markets without sufficient data currently available for use by the Affirm scoring methodology
March 31,
2022
$1,409,388
584,290
232,187
59,753
200,470
57 %
24 %
210,491
$2,486,088 $ 2,485,534
9 %
2 %
8%
June 30, 2022
100 %
$
1,374,223
632,431
223,952
44,437
55 %
26 %
9 %
2 %
8 %
100 %
24View entire presentation