Pathward Financial Results Presentation Deck
ASSET QUALITY
$ in millions
$ in millions
0.48%
$29.8
1020
0.62%
$24.0
1020
Nonperforming Assets ("NPAS")
0.67%
$39.4
2020
0.87%
$31.5
NPAS
2020
0.64%
NPLs
$56.1
3Q20
Period Ended
Nonperforming Loans ("NPLs")
1.10%
NPAS/ Total Assets
$39.3
0.79%
3Q20
Period Ended
$48.0
4Q20
¹ Non-GAAP measures, see appendix for reconciliations.
20
0.97%
$34.0
4Q20
NPLS/ Total Loans
0.73%
$53.2
1Q21
1.18%
$42.3
1021
$ in millions
●
Adjusted Net Charge-Offs ("NCOS")¹
Excludes Tax Services NCOS and Related Seasonal Average Loans
●
0.34%
$3.1
1020
0.24%
$2.2
2020
0.55%
$4.9
3Q20
Period Ended
0.63%
$5.5
4Q20
0.44%
QUARTERLY INVESTOR UPDATE | FIRST QUARTER FISCAL YEAR 2021 | NASDAQ: CASH
$3.8
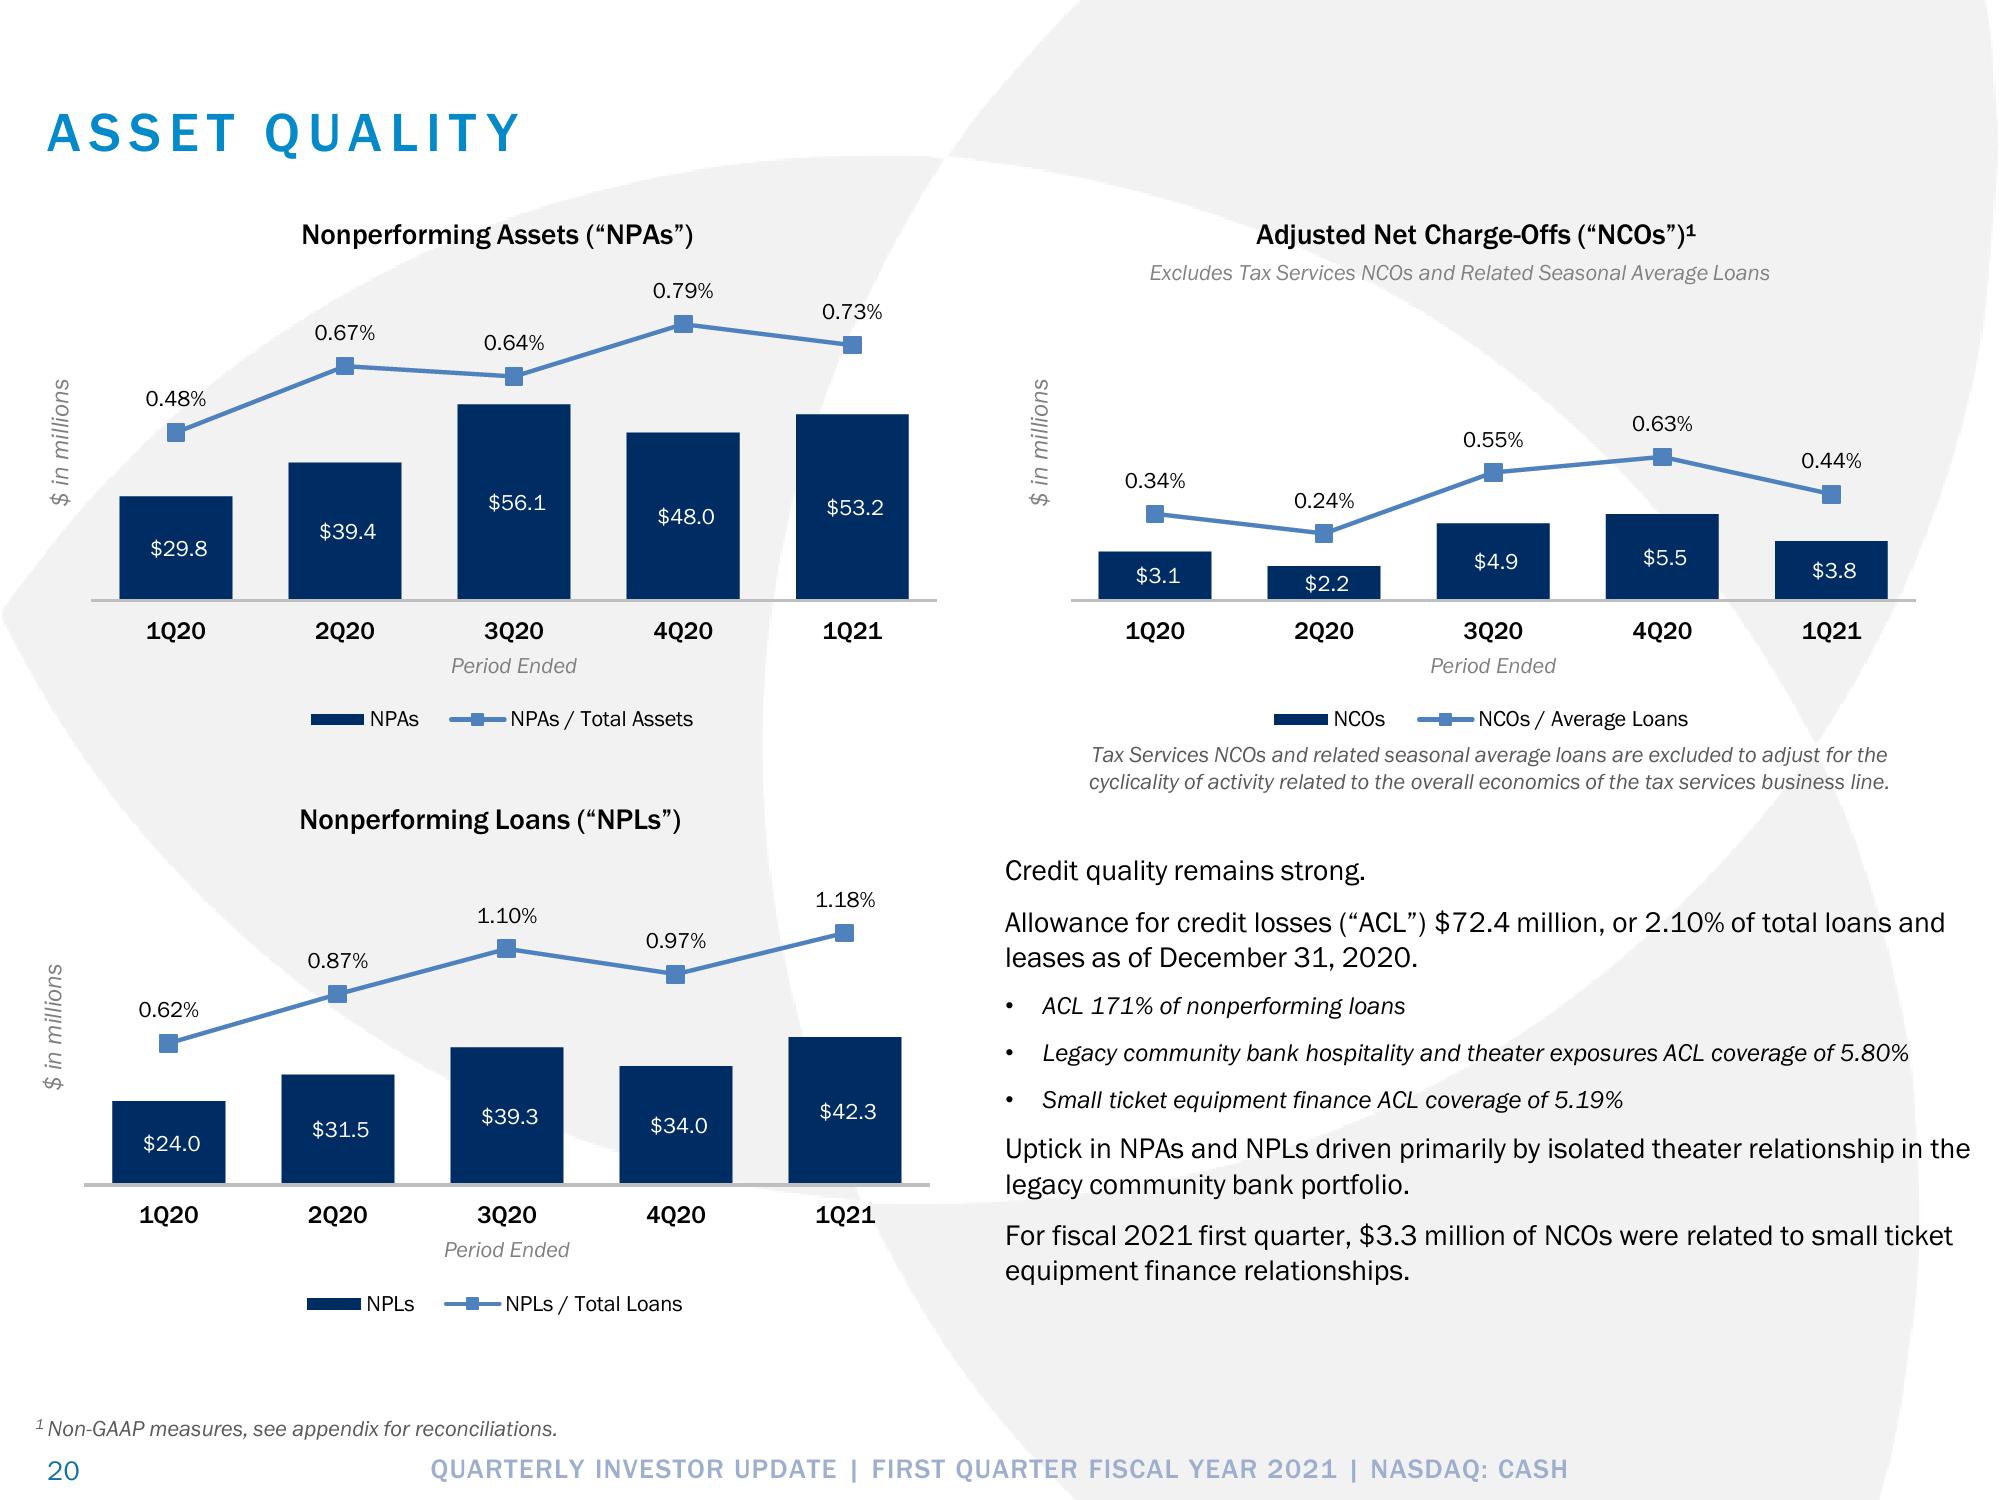
Credit quality remains strong.
Allowance for credit losses ("ACL") $72.4 million, or 2.10% of total loans and
leases as of December 31, 2020.
1021
NCOS
NCOS/ Average Loans
Tax Services NCOs and related seasonal average loans are excluded to adjust for the
cyclicality of activity related to the overall economics of the tax services business line.
ACL 171% of nonperforming loans
Legacy community bank hospitality and theater exposures ACL coverage of 5.80%
Small ticket equipment finance ACL coverage of 5.19%
Uptick in NPAs and NPLs driven primarily by isolated theater relationship in the
legacy community bank portfolio.
For fiscal 2021 first quarter, $3.3 million of NCOs were related to small ticket
equipment finance relationships.View entire presentation