Baird Investment Banking Pitch Book
RELATIVE CONTRIBUTION ANALYSIS APPROACH
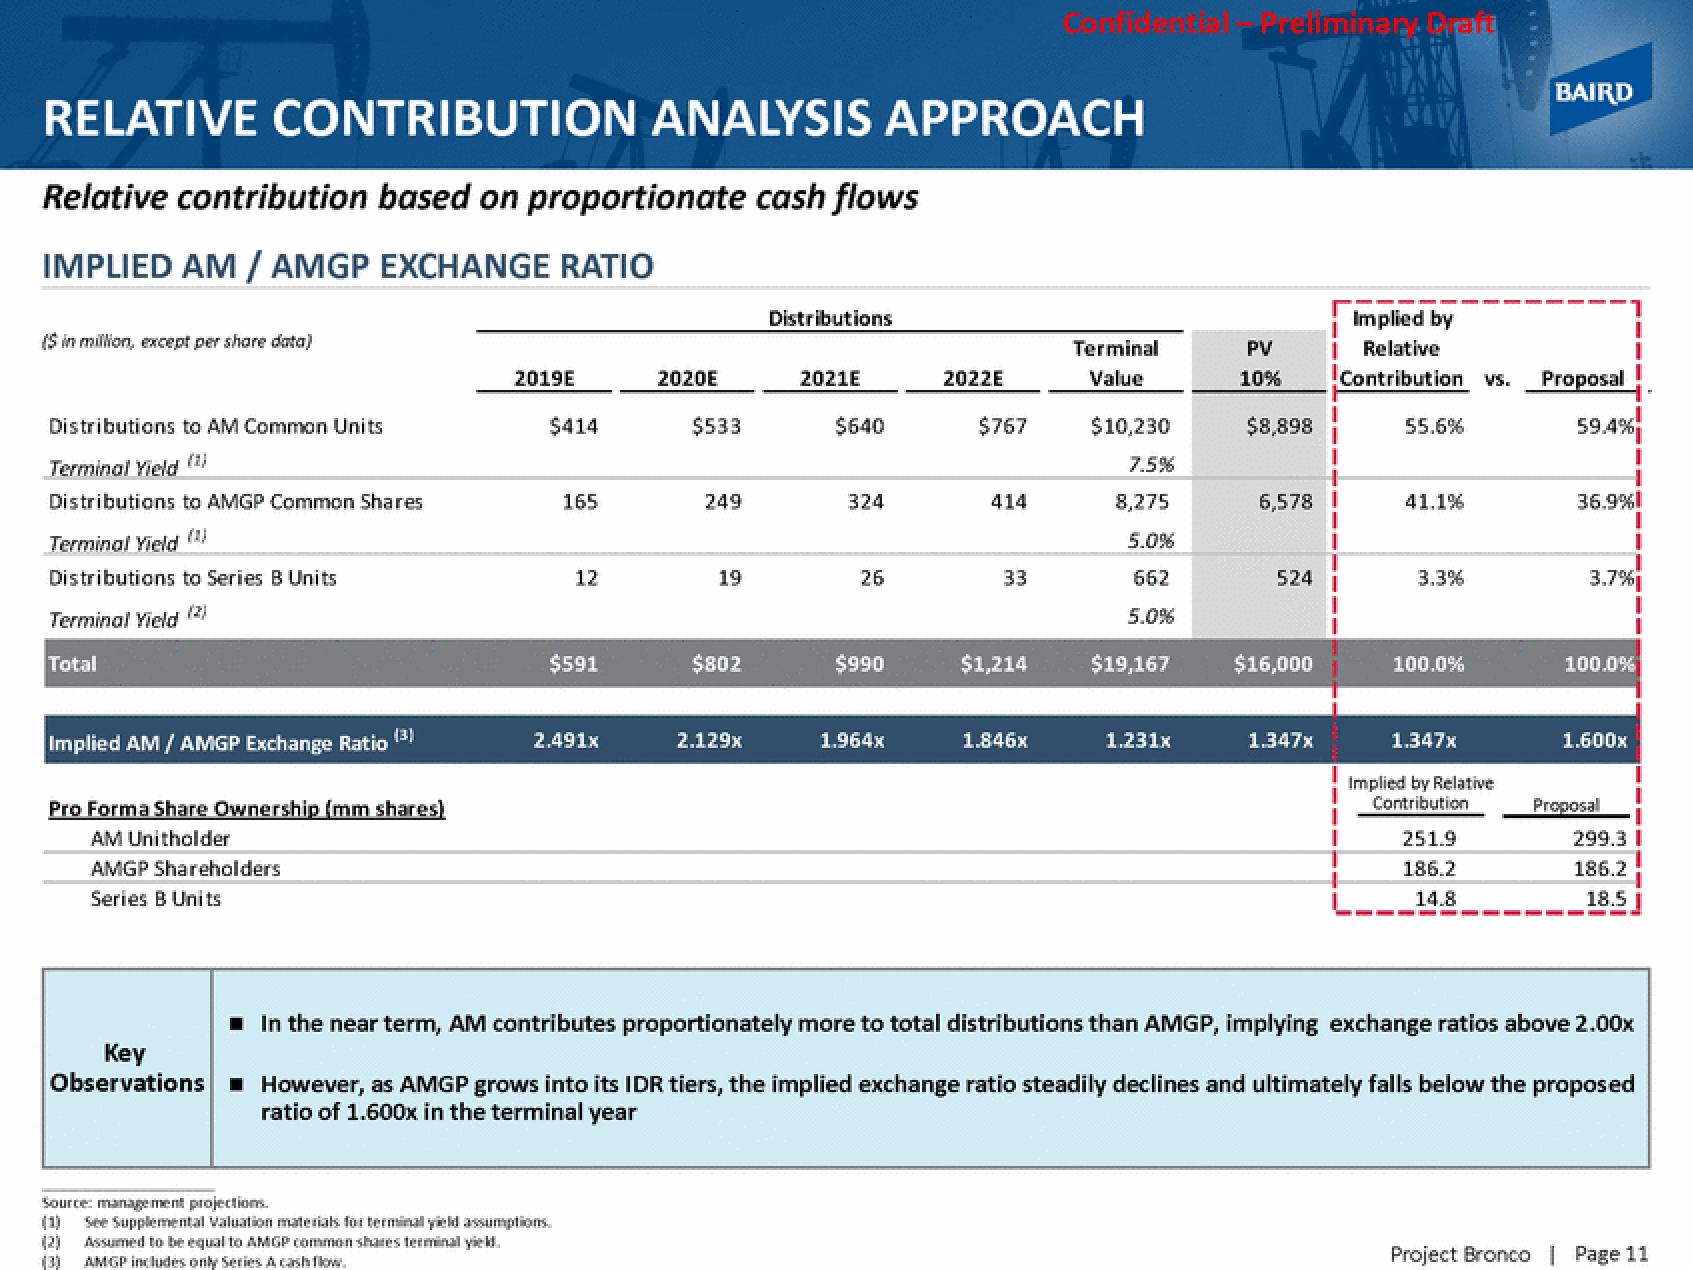
Relative contribution based on proportionate cash flows
IMPLIED AM / AMGP EXCHANGE RATIO
(S in million, except per share data)
Distributions to AM Common Units
Terminal Yield (2)
Distributions to AMGP Common Shares
Terminal Yield (1)
Distributions to Series B Units
Terminal Yield (2)
Total
Implied AM/ AMGP Exchange Ratio
(3)
Pro Forma Share Ownership (mm shares)
AM Unitholder
AMGP Shareholders
Series B Units
Key
Observations
2019E
$414
165
12
$591
2.491x
Source: management projections.
(1) See Supplemental Valuation materials for terminal yield assumptions.
(2) Assumed to be equal to AMGP common shares terminal yield.
AMGP includes only Series A cash flow.
2020E
$533
249
19
$802
2.129x
Distributions
2021E
$640
324
26
$990
1.964x
2022E
$767
414
33
$1,214
1.846x
Terminal
Value
$10,230
7.5%
8,275
5.0%
662
5.0%
$19,167
1.231x
Preliminary Graft
PV
10%
$8,898
6,578 I
524
$16,000
1.347x
I Relative
Contribution vs.
Implied by
1
I
55.6%
41.1%
3.3%
100.0%
1.347x
Implied by Relative
Contribution
251.9
186.2
14.8
BAIRD
Proposal
59.4%
I
36.9%1
I
3.7%
100.0%
1.600x
1
Proposal
299.3 I
186.2
18.5 I
■ In the near term, AM contributes proportionately more to total distributions than AMGP, implying exchange ratios above 2.00x
However, as AMGP grows into its IDR tiers, the implied exchange ratio steadily declines and ultimately falls below the proposed
ratio of 1.600x in the terminal year
Project Bronco | Page 11View entire presentation