Third Quarter 2019 Results
2019 vs. 2018 Non-GAAP Financial Measures - Excluding
Impact of Third Quarter 2018 Dispositions, Repositioning
Actions and the 2017 Tax Act
Operating Profit
Net Interest Expense
Income Tax Expense
Tax Rate %
Income From Equity Method Investments
Net Income Attributed To Noncontrolling Interests
Net Income - Omnicom Group Inc.
$
$
OmnicomGroup
2019
1,475.9
145.5
345.5
26.0%
1.2
62.0
924.1
Year to Date
2018 (a) (b)
$ 1,506.3 $
156.1
343.0
$
25.4%
3.6
83.6
927.2
Non-GAAP 2018
Adjusted
(a) (b)
(a) Please refer to Q3 2018 YTD dispositions, repositioning and tax adjustment footnote on page 3 and additional information on page 28.
Please refer to Q3 2018 YTD tax adjustment footnote on page 3.
$
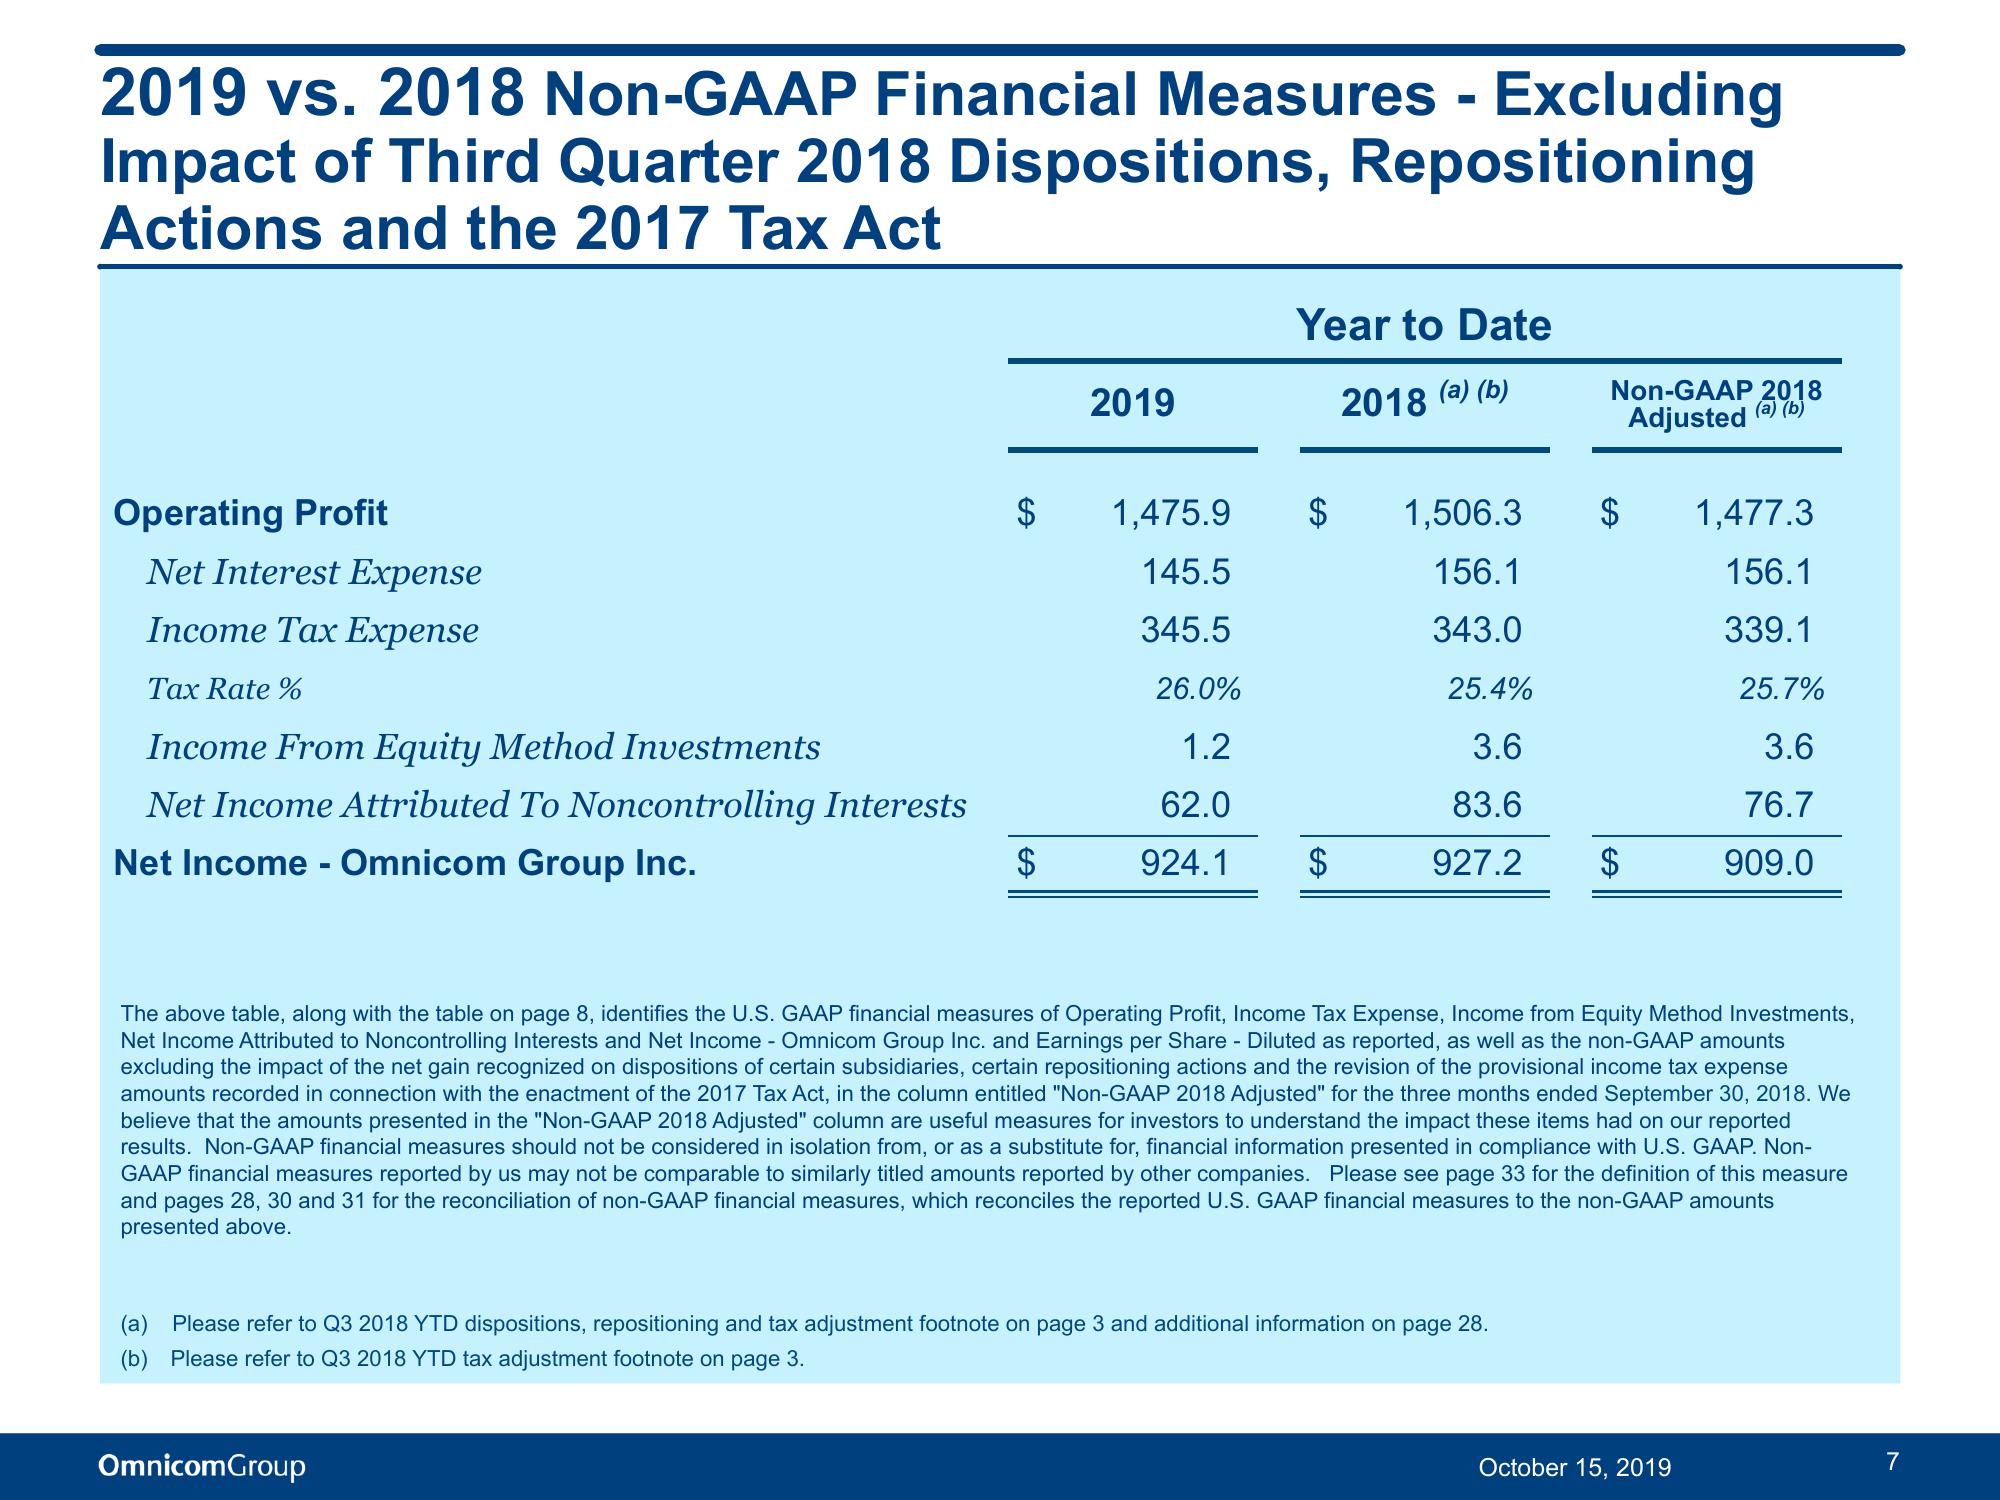
The above table, along with the table on page 8, identifies the U.S. GAAP financial measures of Operating Profit, Income Tax Expense, Income from Equity Method Investments,
Net Income Attributed to Noncontrolling Interests and Net Income - Omnicom Group Inc. and Earnings per Share - Diluted as reported, as well as the non-GAAP amounts
excluding the impact of the net gain recognized on dispositions of certain subsidiaries, certain repositioning actions and the revision of the provisional income tax expense
amounts recorded in connection with the enactment of the 2017 Tax Act, in the column entitled "Non-GAAP 2018 Adjusted" for the three months ended September 30, 2018. We
believe that the amounts presented in the "Non-GAAP 2018 Adjusted" column are useful measures for investors to understand the impact these items had on our reported
results. Non-GAAP financial measures should not be considered in isolation from, or as a substitute for, financial information presented in compliance with U.S. GAAP. Non-
GAAP financial measures reported by us may not be comparable to similarly titled amounts reported by other companies. Please see page 33 for the definition of this measure
and pages 28, 30 and 31 for the reconciliation of non-GAAP financial measures, which reconciles the reported U.S. GAAP financial measures to the non-GAAP amounts
presented above.
1,477.3
156.1
339.1
October 15, 2019
25.7%
3.6
76.7
909.0
7View entire presentation