Dutch Bros Results Presentation Deck
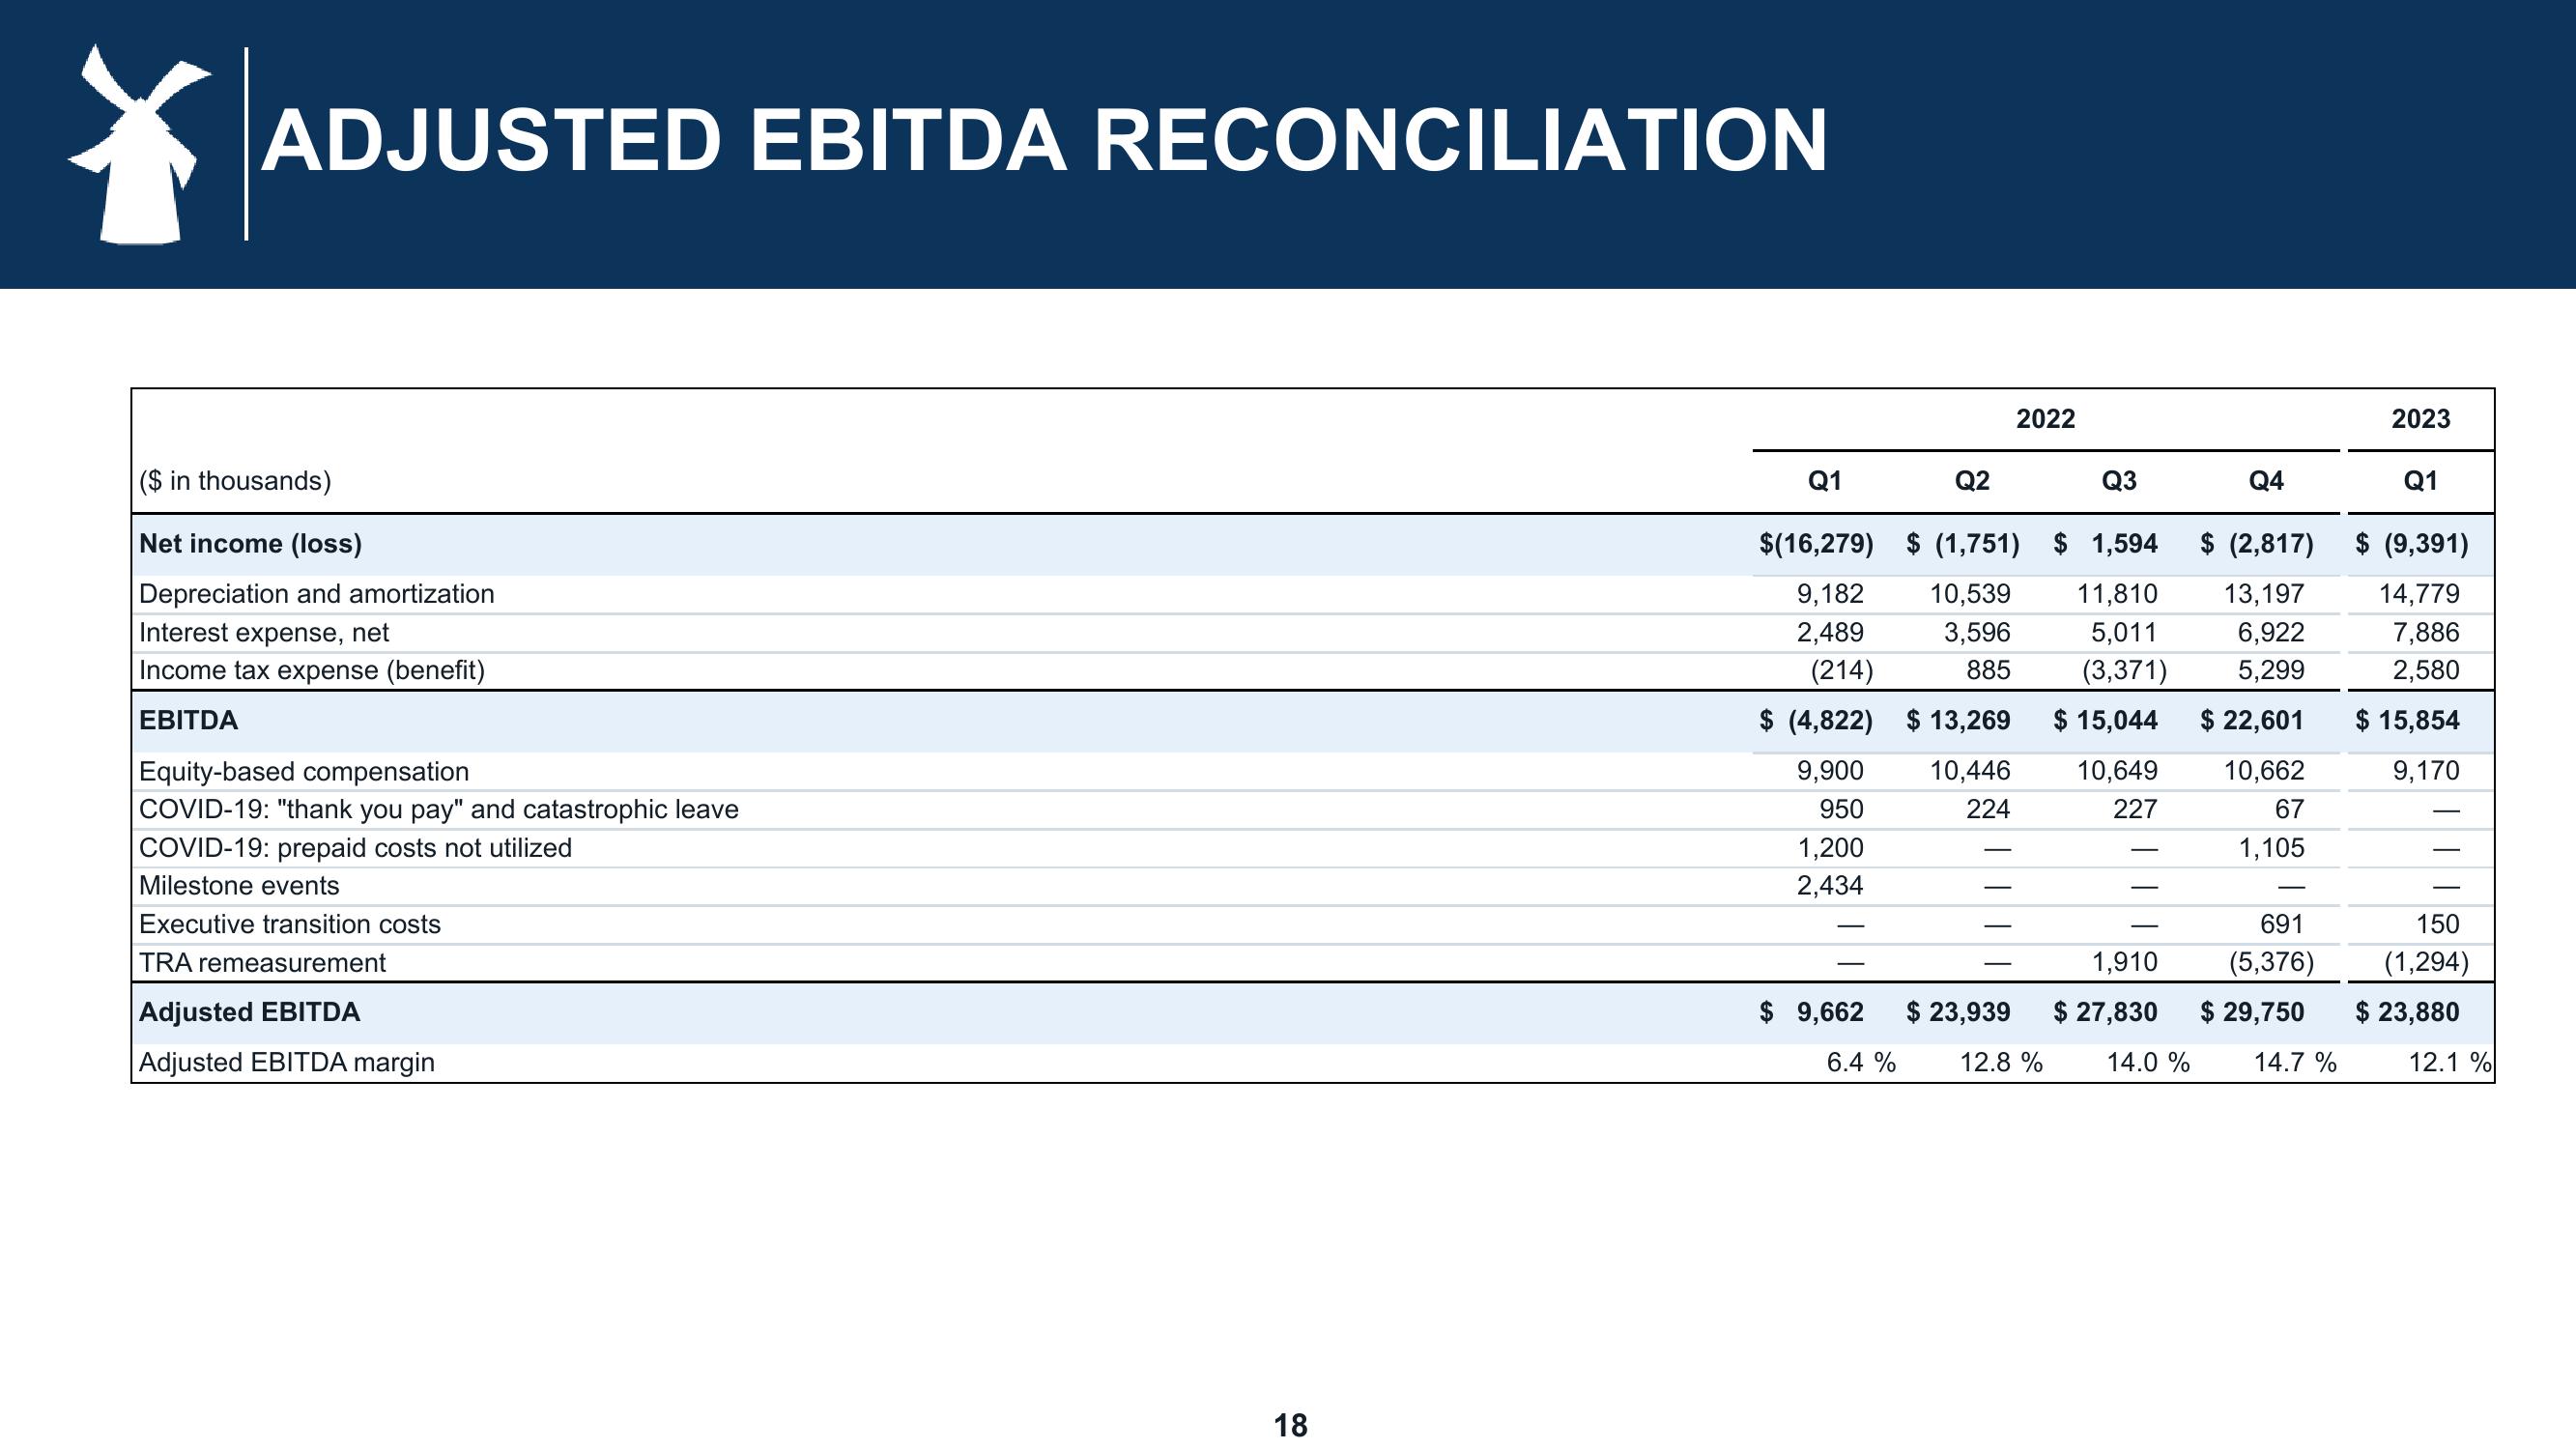
ADJUSTED EBITDA RECONCILIATION
($ in thousands)
Net income (loss)
Depreciation and amortization
Interest expense, net
Income tax expense (benefit)
EBITDA
Equity-based compensation
COVID-19: "thank you pay" and catastrophic leave
COVID-19: prepaid costs not utilized
Milestone events
Executive transition costs
TRA remeasurement
Adjusted EBITDA
Adjusted EBITDA margin
18
Q1
$(16,279)
9,182
2,489
(214)
$ (4,822) $13,269
10,446
224
9,900
950
1,200
2,434
-
$ 9,662
Q2
6.4 %
Q3
$ (2,817)
$ (1,751) $ 1,594
10,539 11,810 13,197
3,596 5,011
6,922
885 (3,371) 5,299
$ 22,601
10,662
67
1,105
$ 15,044
10,649
227
2022
Q4
$ 23,939
12.8 %
691
(5,376)
1,910
$ 27,830 $ 29,750
14.0 % 14.7%
2023
Q1
$ (9,391)
14,779
7,886
2,580
$ 15,854
9,170
150
(1,294)
$ 23,880
12.1 %View entire presentation