SoftBank Results Presentation Deck
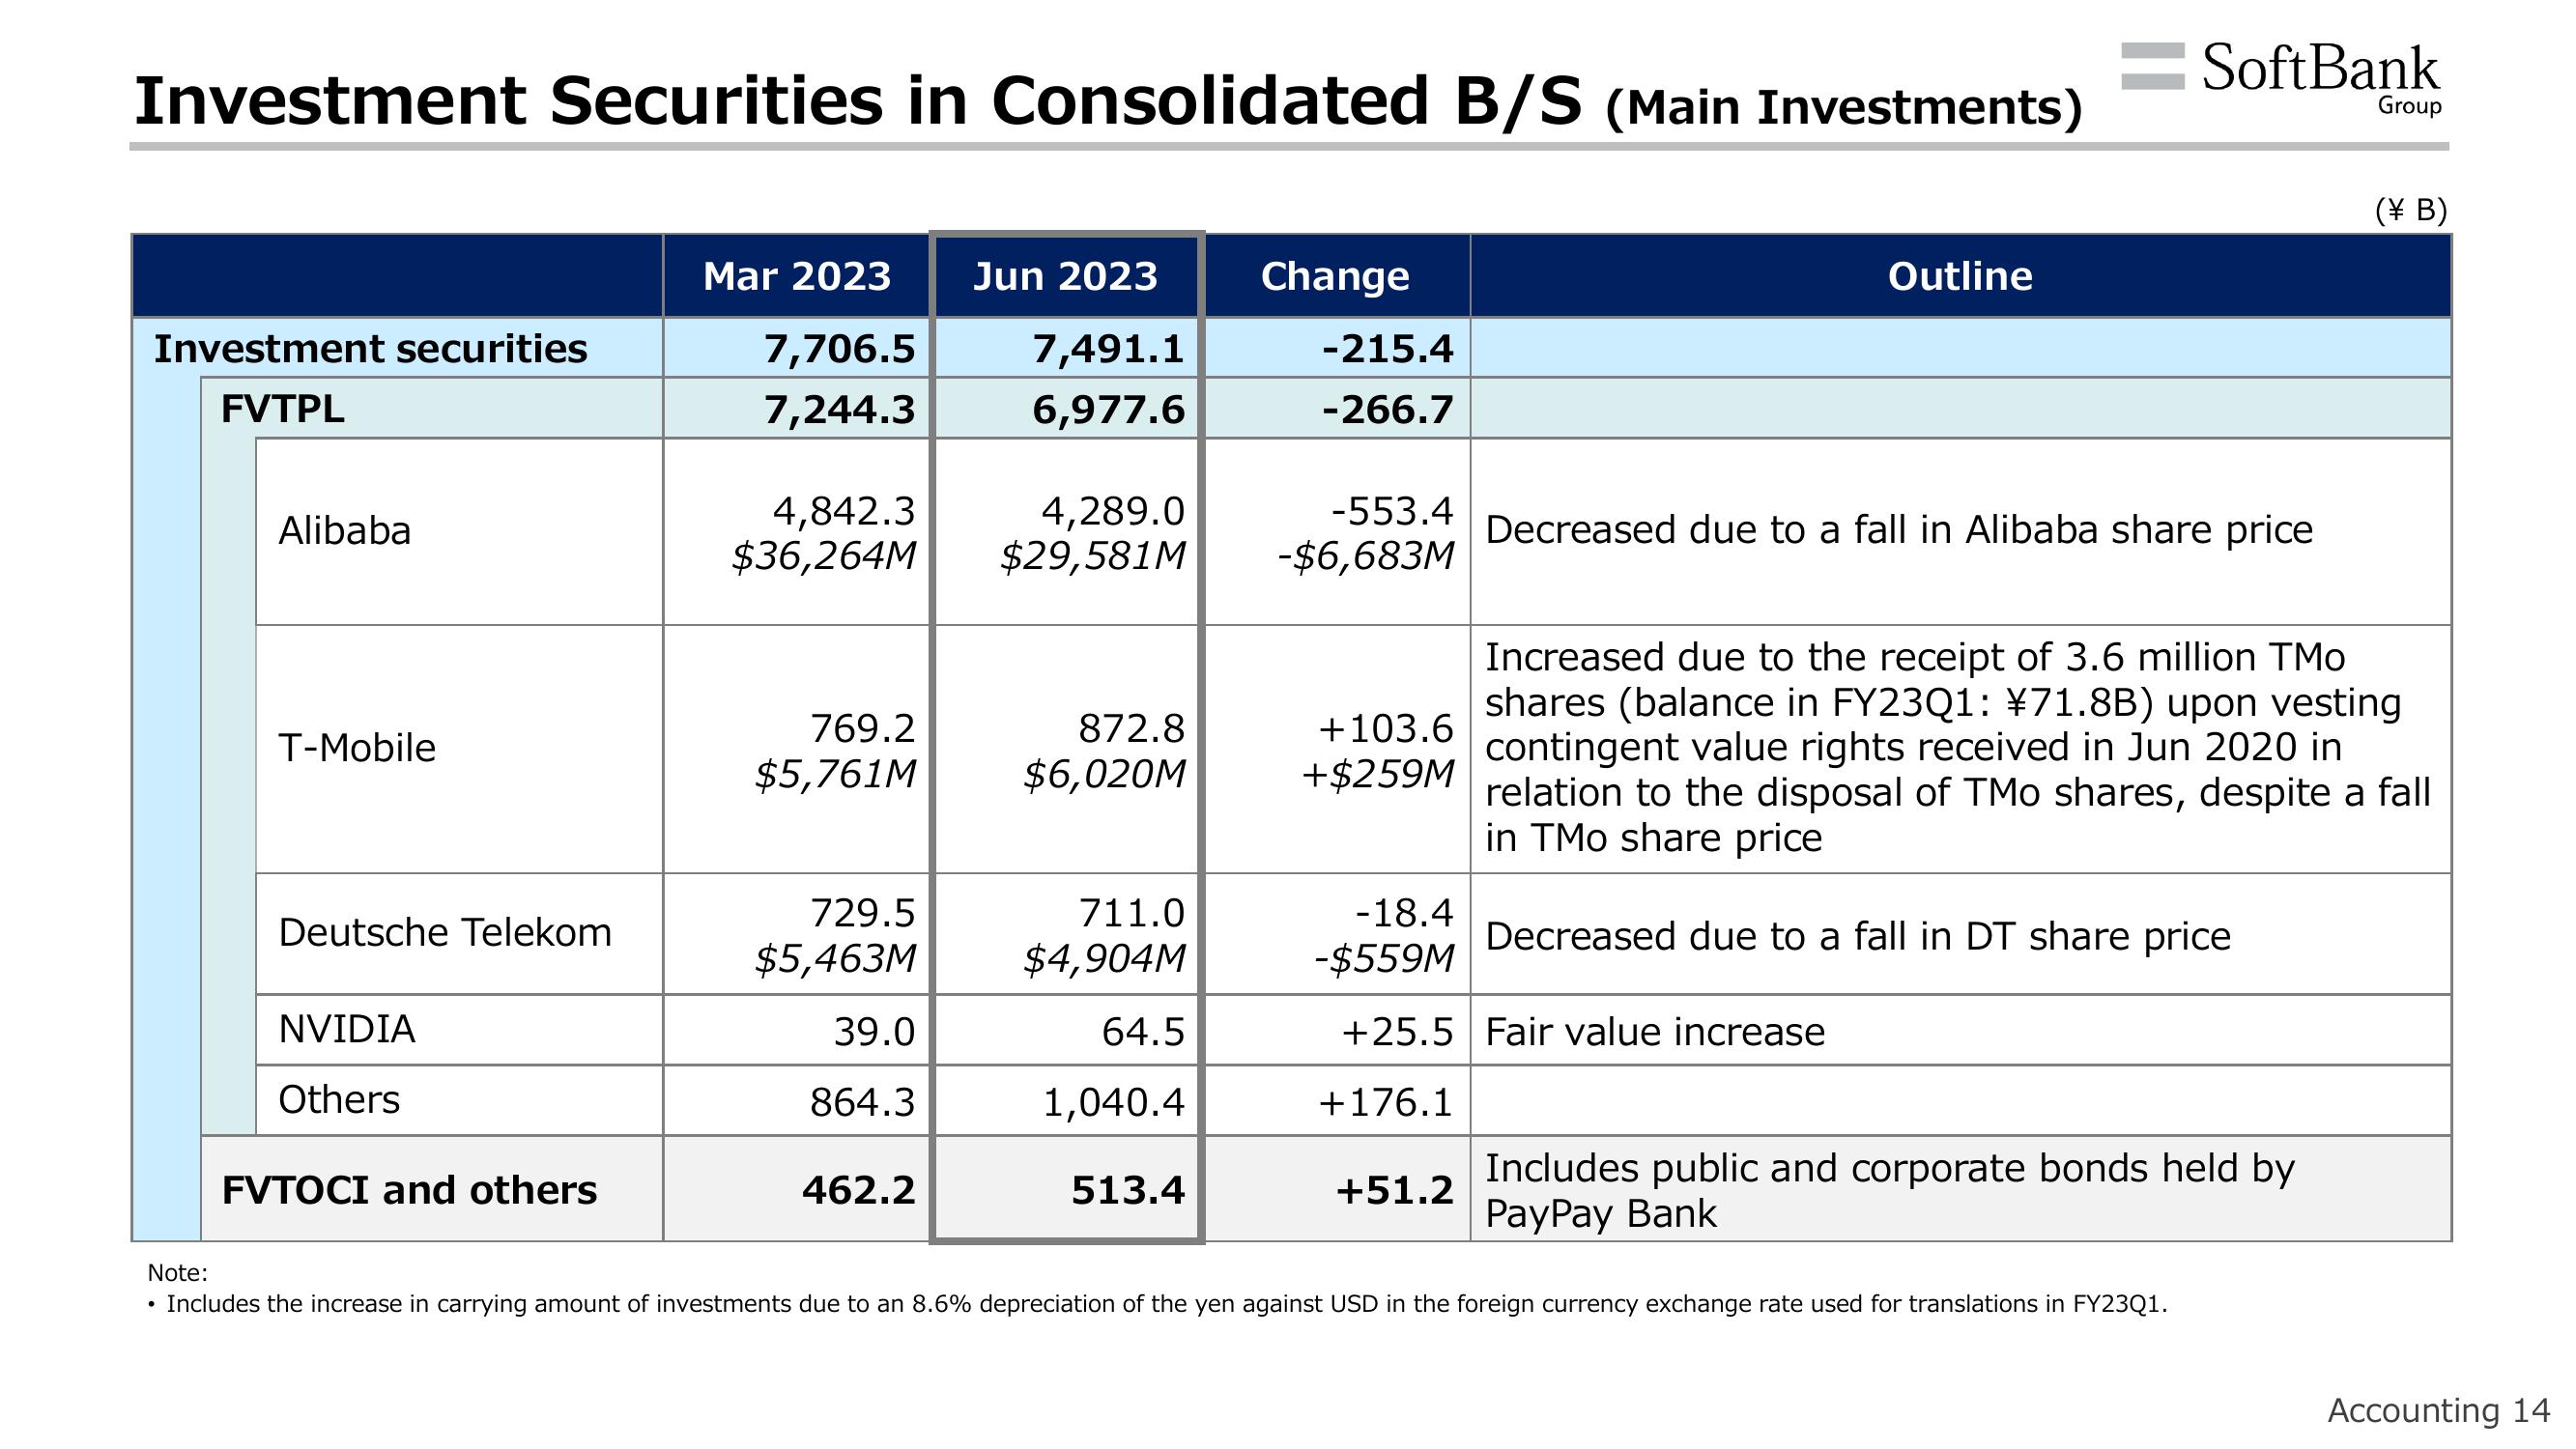
Investment Securities in Consolidated B/S (Main Investments)
Investment securities
FVTPL
Alibaba
●
T-Mobile
Deutsche Telekom
NVIDIA
Others
FVTOCI and others
Mar 2023
7,706.5
7,244.3
4,842.3
$36,264M
769.2
$5,761M
729.5
$5,463M
39.0
864.3
462.2
Jun 2023
7,491.1
6,977.6
4,289.0
$29,581M
872.8
$6,020M
711.0
$4,904M
64.5
1,040.4
513.4
Change
-215.4
-266.7
-553.4
-$6,683M
+103.6
+$259M
+51.2
Outline
-18.4
-$559M
+25.5 Fair value increase
+176.1
Decreased due to a fall in Alibaba share price
SoftBank
Note:
Includes the increase in carrying amount of investments due to an 8.6% depreciation of the yen against USD in the foreign currency exchange rate used for translations in FY23Q1.
Increased due to the receipt of 3.6 million TMo
shares (balance in FY23Q1: ¥71.8B) upon vesting
contingent value rights received in Jun 2020 in
relation to the disposal of TMo shares, despite a fall
in TMo share price
Decreased due to a fall in DT share price
Includes public and corporate bonds held by
PayPay Bank
Group
(\B)
Accounting 14View entire presentation