Spring 2023 Solar Industry Update
.
2022 U.S. Generation and Capacity
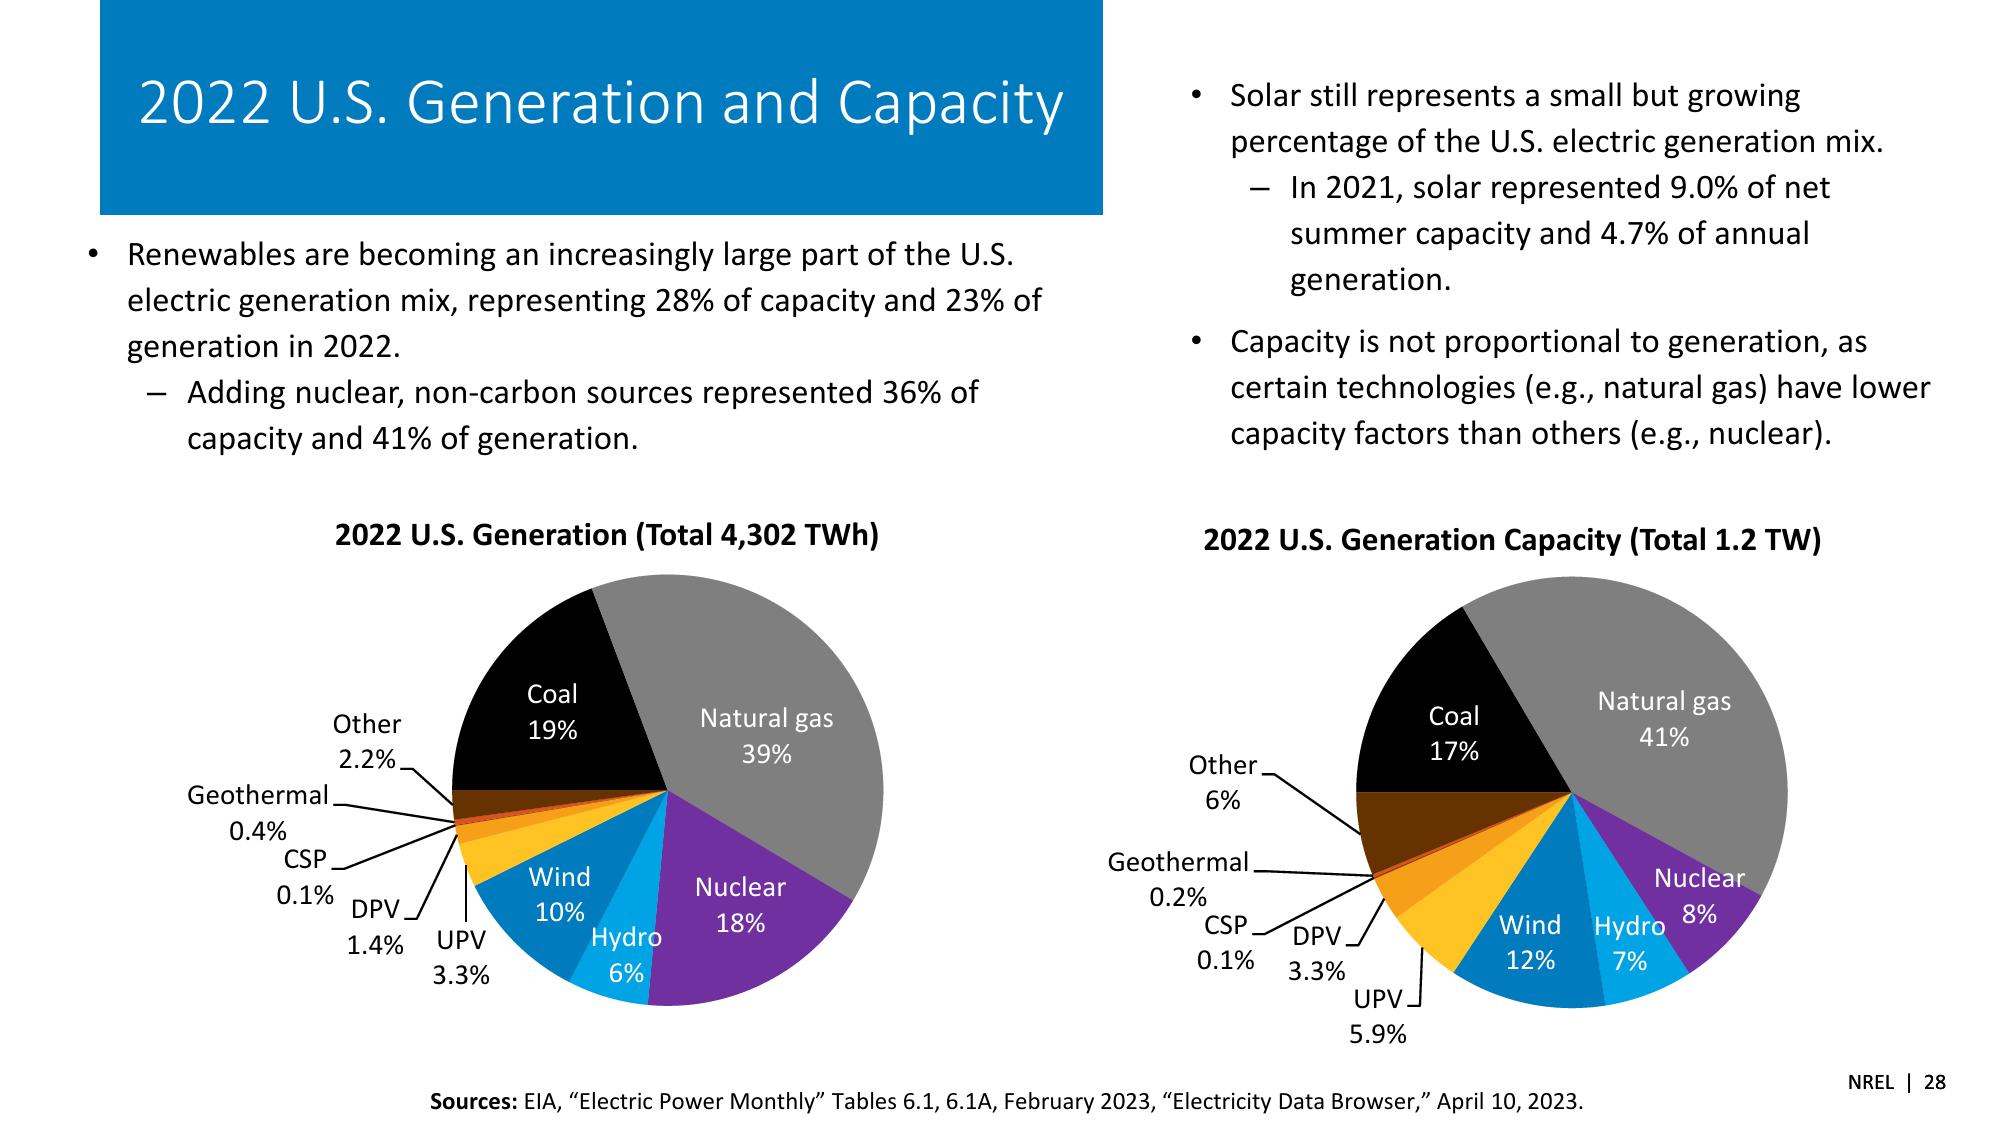
Renewables are becoming an increasingly large part of the U.S.
electric generation mix, representing 28% of capacity and 23% of
generation in 2022.
-
Adding nuclear, non-carbon sources represented 36% of
capacity and 41% of generation.
2022 U.S. Generation (Total 4,302 TWh)
•
•
Solar still represents a small but growing
percentage of the U.S. electric generation mix.
-
In 2021, solar represented 9.0% of net
summer capacity and 4.7% of annual
generation.
Capacity is not proportional to generation, as
certain technologies (e.g., natural gas) have lower
capacity factors than others (e.g., nuclear).
2022 U.S. Generation Capacity (Total 1.2 TW)
Geothermal.
Coal
Other
2.2%
19%
Natural gas
39%
0.4%
CSP
0.1%
DPV
Wind
10%
Nuclear
18%
1.4%
UPV
Hydro
3.3%
6%
Coal
17%
Natural gas
41%
Other
6%
Geothermal.
Nuclear
0.2%
CSP
Wind
8%
DPV
Hydro
0.1%
12%
7%
3.3%
UPV_
5.9%
Sources: EIA, "Electric Power Monthly" Tables 6.1, 6.1A, February 2023, "Electricity Data Browser," April 10, 2023.
NREL | 28View entire presentation