GMS Investor Conference Presentation Deck
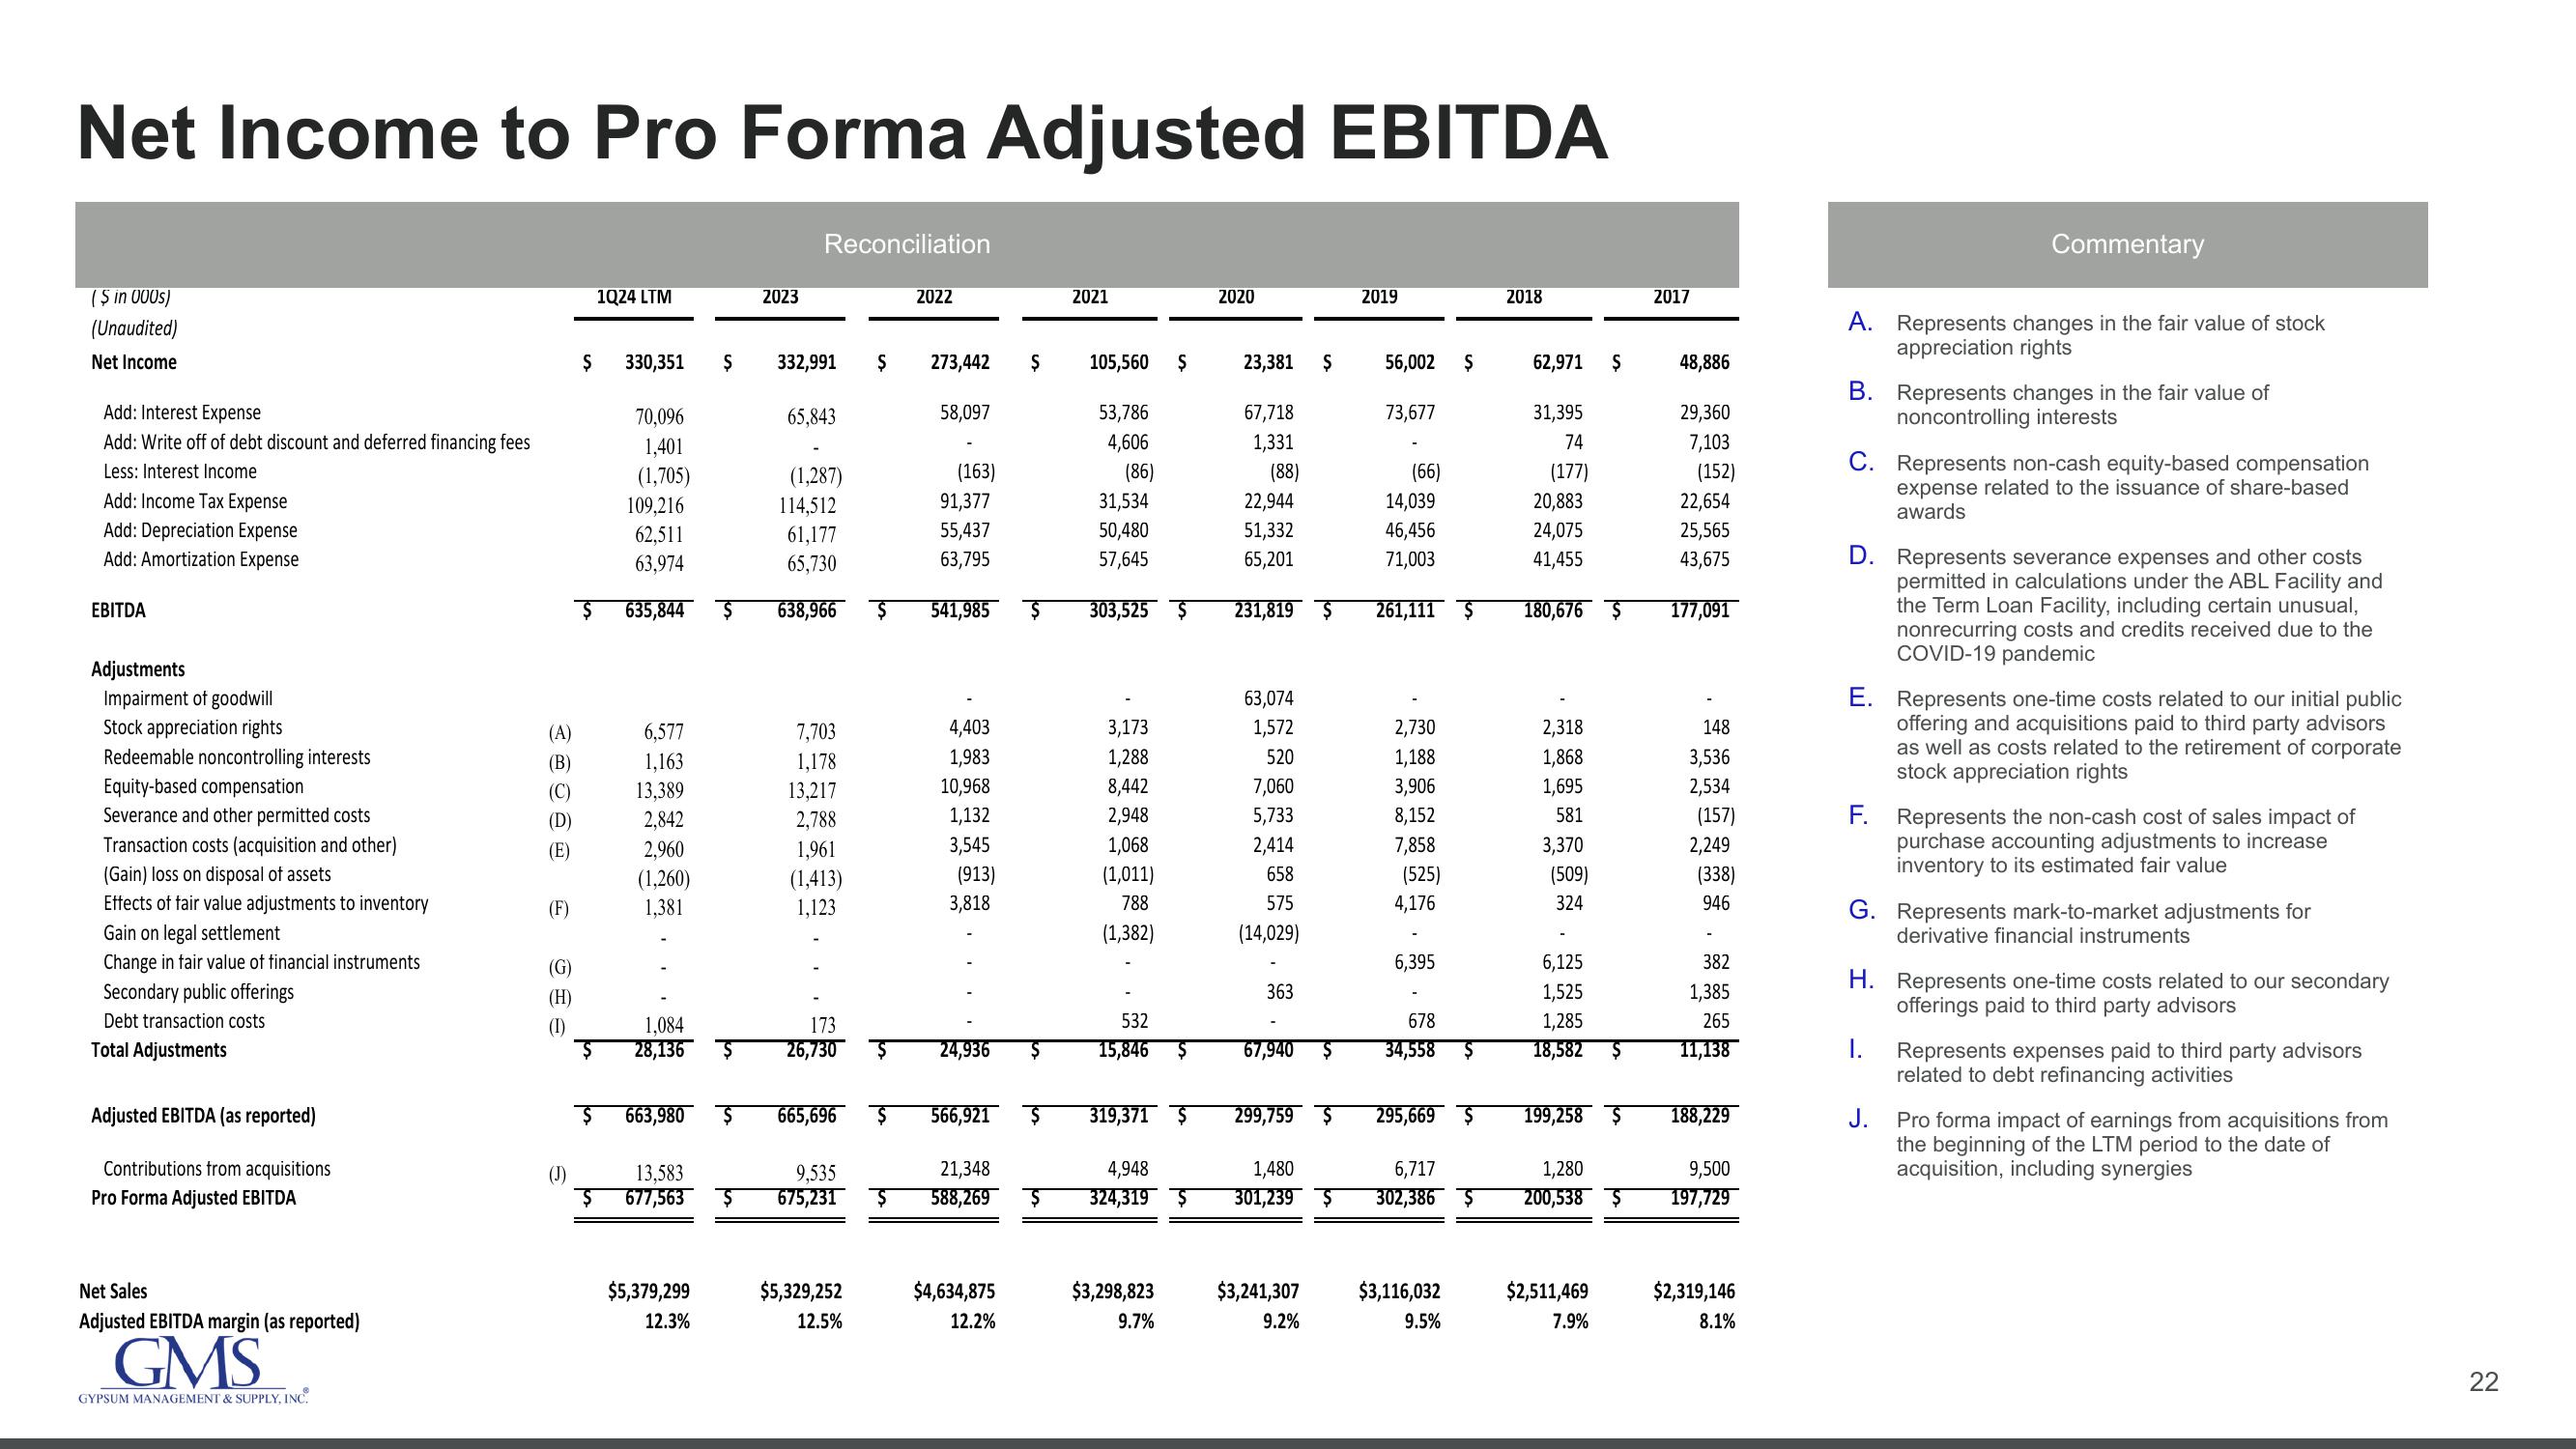
Net Income to Pro Forma Adjusted EBITDA
($ in 000s)
(Unaudited)
Net Income
Add: Interest Expense
Add: Write off of debt discount and deferred financing fees
Less: Interest Income
Add: Income Tax Expense
Add: Depreciation Expense
Add: Amortization Expense
EBITDA
Adjustments
Impairment of goodwill
Stock appreciation rights
Redeemable noncontrolling interests
Equity-based compensation
Severance and other permitted costs
costs (acquisition and other)
(Gain) loss on disposal of assets
Effects of fair value adjustments to inventory
Gain on legal settlement
Change in fair value of financial instruments
Secondary public offerings
Debt transaction costs
Total Adjustments
Adjusted EBITDA (as reported)
Contributions from acquisitions
Pro Forma Adjusted EBITDA
Net Sales
Adjusted EBITDA margin (as reported)
GMS
GYPSUM MANAGEMENT & SUPPLY, INC.
(A)
(B)
(C)
(D
(E)
(F)
(1)
(J)
1Q24 LTM
$ 330,351
$
70,096
1,401
(1,705)
109,216
62,511
63,974
635,844
6,577
1,163
13,389
2,842
2,960
(1,260)
1,381
1,084
28,136
$
$
$5,379,299
12.3%
2023
Reconciliation
332,991
65,843
(1,287)
114,512
61,177
65,730
638,966
7,703
1,178
13,217
2,788
1,961
(1,413)
1,123
173
26,730
$ 663,980 $ 665,696
$
$5,329,252
12.5%
$
9,535
13,583
677,563 $ 675,231 $
2022
273,442
58,097
(163)
91,377
55,437
63,795
541,985
4,403
1,983
10,968
1,132
3,545
(913)
3,818
24,936
$ 566,921 $
21,348
588,269 $
$4,634,875
12.2%
2021
Ş 105,560 S
53,786
4,606
(86)
31,534
50,480
57,645
$ 303,525 $
3,173
1,288
8,442
2,948
1,068
(1,011)
788
(1,382)
532
15,846 $
319,371 $
4,948
324,319 $
$3,298,823
9.7%
2020
63,074
1,572
520
7,060
5,733
2,414
658
575
(14,029)
23,381 Ş
67,718
1,331
(88)
22,944
51,332
65,201
231,819 $ 261,111 $
363
67,940
299,759 $
1,480
301,239 $
2019
$3,241,307
9.2%
56,002
73,677
(66)
14,039
46,456
71,003
2,730
1,188
3,906
8,152
7,858
(525)
4,176
6,395
$
678
34,558 $
295,669 $
6,717
302,386 $
$3,116,032
9.5%
2018
62,971 $
31,395
74
(177)
20,883
24,075
41,455
180,676 $
2,318
1,868
1,695
581
3,370
(509)
324
6,125
1,525
1,285
18,582 $
199,258 $
1,280
200,538 $
$2,511,469
7.9%
2017
48,886
29,360
7,103
(152)
22,654
25,565
43,675
177,091
148
3,536
2,534
(157)
2,249
(338)
946
382
1,385
265
11,138
188,229
9,500
197,729
$2,319,146
8.1%
Commentary
A. Represents changes in the fair value of stock
appreciation rights
B. Represents changes in the fair value of
noncontrolling interests
C. Represents non-cash equity-based compensation
expense related to the issuance of share-based
awards
D. Represents severance expenses and other costs
permitted in calculations under the ABL Facility and
the Term Loan Facility, including certain unusual,
nonrecurring costs and credits received due to the
COVID-19 pandemic
E. Represents one-time costs related to our initial public
offering and acquisitions paid to third party advisors
as well as costs related to the retirement of corporate
stock appreciation rights
F. Represents the non-cash cost of sales impact of
purchase accounting adjustments to increase
inventory to its estimated fair value
G. Represents mark-to-market adjustments for
derivative financial instruments
H. Represents one-time costs related to our secondary
offerings paid to third party advisors
Represents expenses paid to third party advisors
related to debt refinancing activities
J.
Pro forma impact of earnings from acquisitions from
the beginning of the LTM period to the date of
acquisition, including synergies
22View entire presentation